Bitcoin
  Ethereum
  Tether
  BNB
BNB  XRP
XRP  USDC
USDC  Solana
  TRON
TRON  Figure Heloc
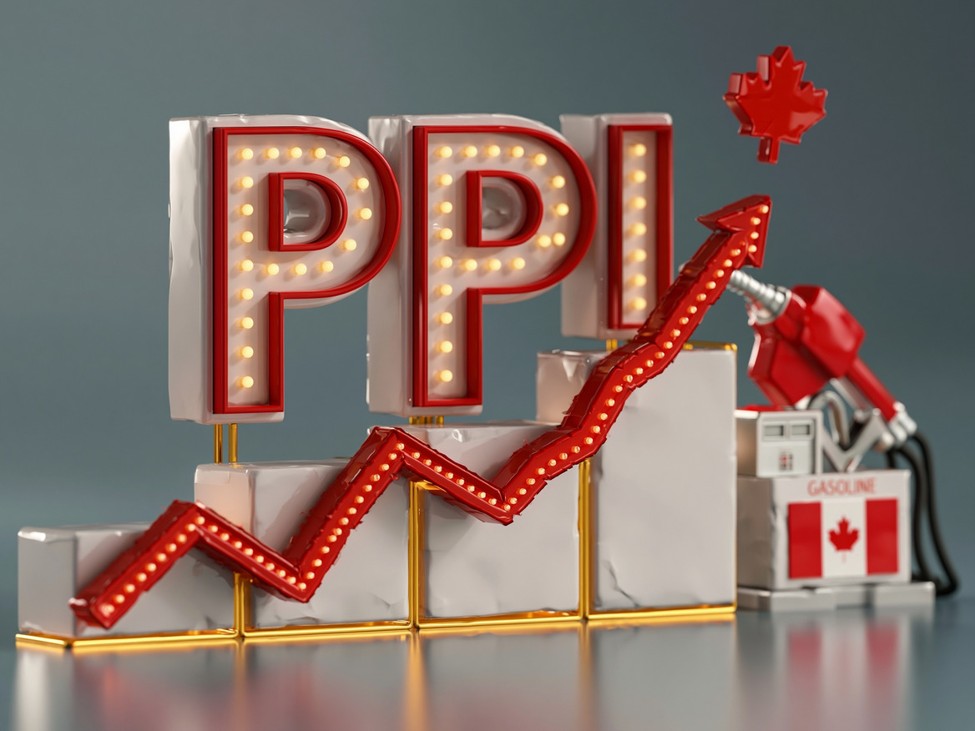
Prior was 2.4% (revised to +2.8%)PPI Y/Y +11.4% vs +7.8% prior (revised to +8.4%)Raw materials price index M/M +2.6% vs +12.0% prior (revised to +11.9%)Raw material price index Y/Y +31.6% vs +23.6% prior (revised to +23.4%)StatCan notes: “the PPI rose 2.0% in April, the fourth consecutive monthly increase for the index. Disruptions to shipping in the Strait of Hormuz, an important global shipping lane for petroleum and other products, exerted significant upward pressure on the prices of several commodities for the second consecutive month. Most notably, the supply disruption influenced prices for energy and petroleum products, chemicals and chemical products, and unwrought aluminum and aluminum alloys (under the primary non-ferrous metal products commodity group). Energy and petroleum products was the primary contributor to the PPI’s month-over-month increase in April. Excluding energy and petroleum products, the PPI increased 1.1% during the month.”For background, Canada’s two key producer price gauges, the Industrial Product Price Index (IPPI) and the Raw Materials Price Index (RMPI), are published monthly by Statistics Canada, typically around the 20th of the following month. The IPPI measures prices received by Canadian manufacturers for goods sold at the factory gate, excluding indirect taxes, tariffs, and downstream transportation or distribution costs. The RMPI, by contrast, captures prices paid by Canadian manufacturers for key raw material inputs, including freight, net taxes, and duties, making it a useful leading indicator for pipeline cost pressures. Both are reported on a January 2020 = 100 base and feed into the calculation of real GDP by industry in the national accounts. While the IPPI does not measure the direct impact of tariffs, cross-border duties can influence the series indirectly through input costs and supply-demand dynamics, a factor that has drawn extra attention amid recent Canada-U.S. trade frictions.
This article was written by Giuseppe Dellamotta at investinglive.com.
💡 DMK Insight
The recent PPI data shows a significant uptick, and here’s why that matters: inflation pressures are intensifying. With the PPI rising to +11.4% year-over-year, up from +7.8%, traders need to reassess their positions, especially in commodities and inflation-sensitive assets. This could lead to further tightening from central banks, impacting interest rates and forex markets. The raw materials price index also reflects this trend, with a monthly increase of +2.6%, suggesting that supply chain issues persist. If inflation continues to rise, we might see a shift in market sentiment, particularly in sectors like energy and materials, which are already experiencing volatility. Keep an eye on how these numbers affect the USD, as a stronger dollar could emerge if the Fed reacts aggressively to curb inflation. For traders, the key levels to watch are the PPI’s influence on the upcoming Fed meeting and any potential shifts in commodity prices. The immediate impact could be felt in the next few weeks, especially if inflation data continues to surprise to the upside.
📮 Takeaway
Watch for how the PPI influences Fed policy; a strong dollar could emerge if inflation pressures persist.