Bitcoin
  Ethereum
  Tether
  XRP
XRP  BNB
BNB  USDC
USDC  Solana
  TRON
TRON  Figure Heloc
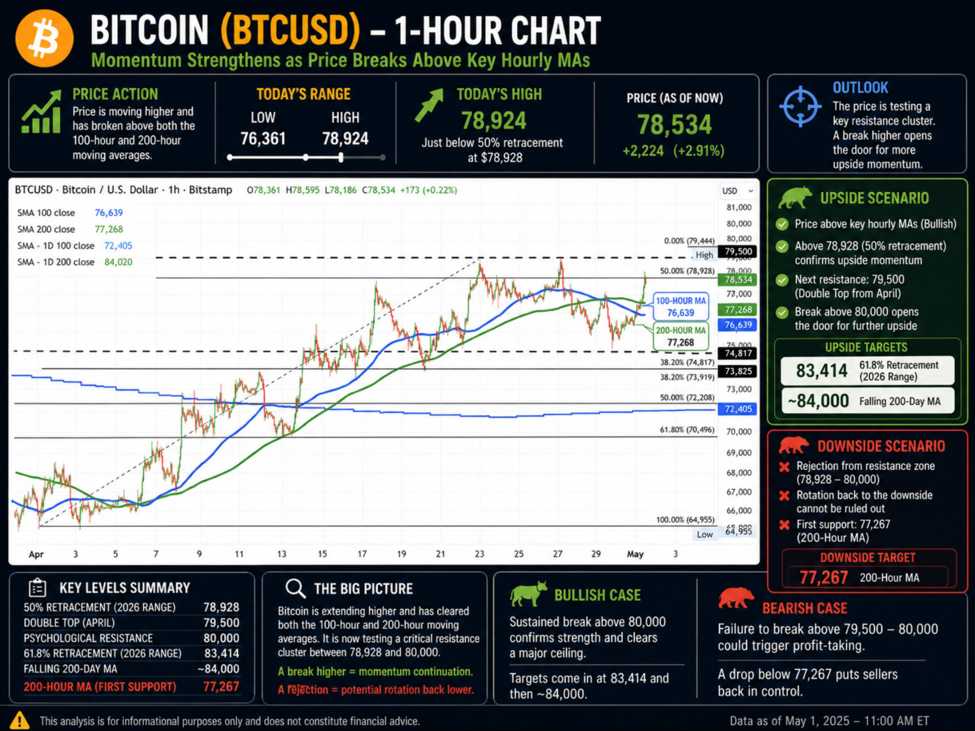
Bitcoin is pushing higher today, with price action gaining momentum as it breaks above both key short-term barometers—the 100-hour moving average at $76,638 and the 200-hour moving average at $77,267. That upside extension has carried the price to a session high of $78,924, bringing it right up against a critical technical level: the 50% retracement of the 2026 trading range at $78,928.While the move higher is constructive for buyers, it’s also running directly into a dense cluster of resistance. Just above sits a double top from April near $79,500, followed by the psychologically important $80,000 level. In other words, the rally is real—but it’s now being tested in a zone where sellers have historically leaned.That said, this is where the opportunity—and the challenge—lies for buyers. A sustained break above $80,000 would clear a key ceiling and open the door for further upside momentum. From there, the next targets come in at the 61.8% retracement of the 2026 range at $83,414, followed by the falling 200-day moving average near $84,000.On the flip side, if the price fails to push through this resistance zone and rotates lower, the focus shifts back to downside risk. The 200-hour moving average at $77,267 becomes the first key support target. A move back below that level would signal that the breakout has stalled and that sellers are regaining control.Bottom line: the bias has turned more bullish with the break above the key hourly moving averages, but the market is now at a critical inflection point. The battle between buyers and sellers is unfolding right at resistance—stay above and break higher, or fail and rotate back lower.
This article was written by Greg Michalowski at investinglive.com.
💡 DMK Insight
Bitcoin’s recent surge above the 100-hour and 200-hour moving averages is a strong bullish signal. Breaking through these key levels at $76,638 and $77,267 indicates increased buying pressure, with the price hitting a session high of $78,924. This momentum could attract more traders looking for short-term gains, especially if it holds above these moving averages. Watch for a potential retest of these levels; if they hold as support, it could pave the way for further upside. However, if Bitcoin fails to maintain this position, a pullback could lead to increased volatility, particularly for those holding long positions. Keep an eye on the RSI and MACD indicators for signs of overbought conditions, which could signal a reversal. On the flip side, while the bullish sentiment is palpable, it’s worth noting that market corrections often follow significant rallies. Traders should be cautious of a potential short squeeze if the price retraces below the 200-hour moving average. Monitoring the $76,638 and $77,267 levels will be crucial in the coming sessions to gauge market sentiment and potential trading strategies.
📮 Takeaway
Watch for Bitcoin to hold above $76,638 and $77,267; failure to do so could trigger a pullback.