
 Bitcoin
  Ethereum
  Tether
  BNB
BNB  XRP
XRP  USDC
USDC  Solana
  TRON
TRON  Lido Staked Ether
  Figure Heloc
Don’t want to comment on forex levels, interventionBut is extremely concerned about speculative movesThe stance by the government has always been to take appropriate action on forex mattersA bit of a verbal warning shot there as Tokyo officials continue to be alarmed by USD/JPY lingering above 159.00 but still not yet wanting to take a run at the 160.00 level. But even so, we’ve already seen the rebound in the currency pair over the last few weeks. And that is one that almost negates the entirety of Japan’s intervention efforts since late April.We are expected to see some intervention data come out later in the day. But at this point, it should just confirm what we already know and not offer too much else.From earlier this week:USD/JPY continues to nudge higher in testing Japan’s intervention limitsUSD/JPY faces up against risk of another round of FX intervention – Credit Agricole This article was written by Justin Low at investinglive.com. 🔗 Source 💡 DMK Insight The USD/JPY hovering above 159.00 is raising red flags for Tokyo officials, and here’s why that matters: Speculative moves in the forex market can lead to volatility, and the Japanese government is clearly on alert. A sustained level above 159.00 could prompt intervention, which historically has led to sharp corrections. Traders should be wary of potential government actions that could shift market dynamics quickly. If USD/JPY breaks decisively above this level, it might trigger a wave of selling in JPY pairs, impacting not just the yen but also related assets like Japanese equities and commodities priced in yen. Keep an eye on how the market reacts to any verbal warnings or policy shifts from officials in the coming days. On the flip side, if the USD/JPY starts to retreat, it could signal a shift in sentiment, possibly leading to a short-term rally in JPY as traders cover their positions. Watch for any statements from the Bank of Japan or economic data releases that could influence this pair. The next few sessions will be crucial for determining the direction of USD/JPY, so stay alert for any signs of intervention or policy changes. 📮 Takeaway Monitor USD/JPY closely around the 159.00 level; any sustained movement above could trigger intervention, impacting market volatility significantly.

German unemployment falls unexpectedly in May, jobless rate down slightly as well
Unemployment change -12k vs 10k expectedPrior 20kUnemployment rate 6.3% vs 6.4% expectedPrior 6.4%The jobless figure shows a drop of 12,000 and that brings the overall unadjusted number of unemployed persons to 2.95 million. That being said, this likely should be a one-off and doesn’t excuse the fact that the labour market picture has been softening in recent months.The unemployment rate held steady for most of 2025 but the broader trend reflects a decline since 2023. And that fits with weakening economic conditions in Europe’s largest economy as well, especially in the industry sector. And with the US-Iran conflict now, things look set to continue down that path again potentially.The German labour office notes that “despite a decline in unemployment, the spring upturn has not really gained momentum this year”. This article was written by Justin Low at investinglive.com. 🔗 Source 💡 DMK Insight The unexpected drop in unemployment by 12,000 is a mixed bag for traders right now. While the unemployment rate dipped to 6.3%, which is better than the anticipated 6.4%, the overall context suggests this could be a temporary blip rather than a trend. The labor market still faces underlying issues, and this one-off decrease doesn’t change the broader economic picture. Traders should keep an eye on related indicators like job creation numbers and wage growth, as these will provide more clarity on whether this is a genuine improvement or just noise. If the labor market shows more signs of weakness, it could lead to volatility in both forex and equity markets, particularly affecting sectors sensitive to consumer spending. Watch for the next jobless claims report and any shifts in Federal Reserve policy, as these could significantly impact market sentiment. If unemployment trends upward again, expect a bearish reaction across risk assets, while a sustained drop could bolster bullish sentiment in equities and risk-on currencies. 📮 Takeaway Keep an eye on upcoming jobless claims; a rise could signal bearish trends in equities and forex, while sustained drops may support bullish sentiment.
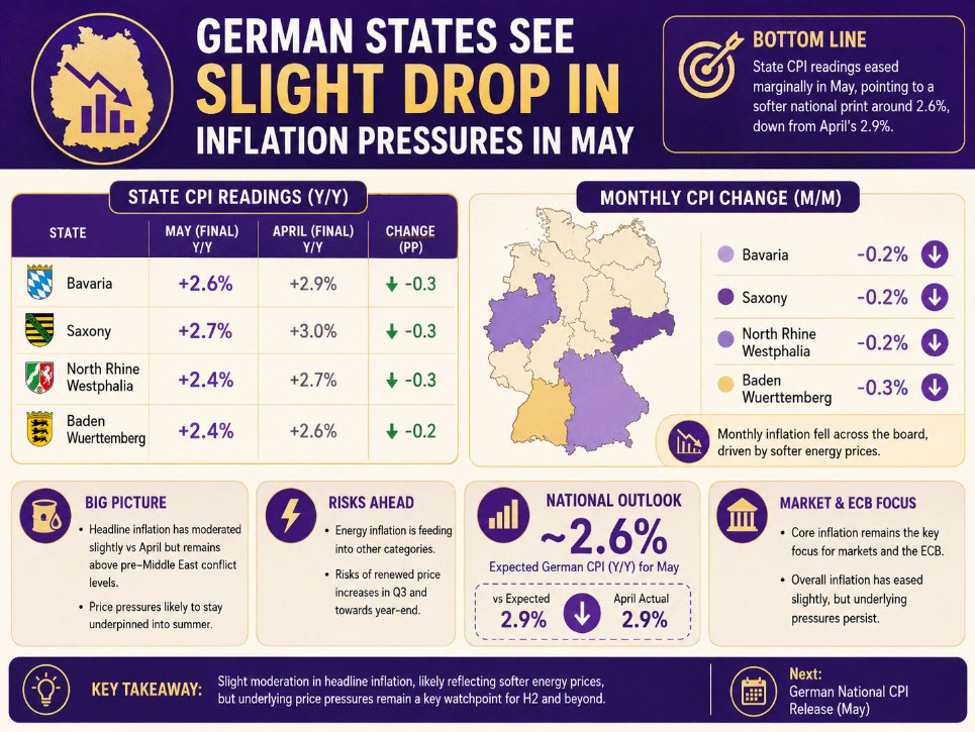
German states see slight drop in inflation pressures in May
Here are all the state readings released around the same time:Bavaria CPI +2.6% vs +2.9% y/y priorSaxony CPI +2.7% vs +3.0% y/y priorNorth Rhine Westphalia CPI +2.4% vs +2.7% y/y priorBaden Wuerttemberg CPI +2.4% vs +2.6% y/y priorIt’s a bit of a change up compared to the preliminary readings for France and Spain earlier in the day. Even the monthly estimates here point to a marginal drop across the board. The breakdown shows monthly inflation falling in Bavaria (-0.2%), Saxony (-0.2%), North Rhine Westphalia (-0.2%), and Baden Wuerttemberg (-0.3%).Overall, that points to slightly softer headline annual inflation estimates when compared to April. That being said, they still represent a modest jump since the Middle East conflict began. And given the state of things, we are likely to see price pressures continue to stay underpinned going into the summer months.And as energy price inflation becomes more embedded into other categories, that will risk seeing a further increase in prices in Q3 and even in the months after towards the end of this year. So, just be wary of that.Circling back to the numbers here, this likely points to the national reading later coming in around 2.6% at the balance. And that will be off the expected 2.9% reading, which was also the April estimate.If anything, this points to some moderation in energy prices since last month. But in the overall picture, core inflation/prices will still be the main focus for markets and the ECB. This article was written by Justin Low at investinglive.com. 🔗 Source 💡 DMK Insight Germany’s CPI readings are cooling down, and here’s why that matters for traders: The latest inflation figures from key German states show a downward trend, with Bavaria at +2.6%, Saxony at +2.7%, and North Rhine Westphalia at +2.4%. This is a shift from previous readings and could signal a broader easing of inflationary pressures. For traders, this is crucial as it may influence the European Central Bank’s (ECB) monetary policy decisions. If inflation continues to decline, the ECB might reconsider its interest rate hikes, which could lead to a weaker euro against the dollar and other currencies. Keep an eye on the euro’s response in the forex market, particularly if it approaches key support levels. But there’s a flip side: while lower inflation might seem positive, it could also indicate slowing economic growth, which could dampen market sentiment. Traders should watch for any shifts in economic indicators that could suggest a recessionary trend. The immediate focus should be on the euro’s performance against the dollar, especially if it tests the 1.05 level. If it breaks below that, it could trigger further selling pressure. Watch for upcoming economic reports that could provide more clarity on this situation. 📮 Takeaway Monitor the euro closely, especially around the 1.05 level, as declining CPI could shift ECB policy and impact forex trading strategies.

ETH Futures Analysis Today: 1968-1973 Support Holds, 2033-2036 Key Resistance
ETH analysis today: Bulls defend 1968-1973, but 2033-2036 remains the key confirmation zoneETH JUN26 futures are showing a short-term bullish repair after sellers failed to extend below the 1968-1973 support floor. The current score is +3.5 / +10, or roughly +3 to +4 for practical use, but the repair remains contested until ETH can sustain above 2033.5-2036.Key takeaways for ETH futures tradersMain support floor: 1968-1973Tactical repair line: 2000Current resistance zone: 2018-2033Bullish confirmation zone: 2033.5-2036Current prediction score: +3.5 / +10Market state: Short-term bullish repair, but not yet a clean bullish takeoverI’ve been tracking Bitcoin’s attempt to turn the recent $72,900 flush into a bullish pivot, watching futures closely from the $73,125 level for a clear reversal. While both BTC and ETH futures are currently repairing higher and trading above VWAP, I’m still seeing limited order-flow confirmation to back up the move. To trust this recovery, I need to see bulls step up with solid volume and confirm a break above key resistance levels, specifically $74,000 for BTC and the $2,030 to $2,035 zone for ETH.ETH futures have likely shifted away from the clean bearish initiative that dominated from May 26 into May 27. Sellers pushed aggressively lower, but their downside efficiency weakened near the 1973-1968 region. That area now stands out as the key structural support floor for ETH JUN26 futures.The strongest bullish evidence came after the market rejected the 1968 low, reclaimed the 1990s, and then printed a major positive-delta impulse at 13:43 on May 28. That bar helped confirm that the move had changed from passive support defense into active buyer participation.However, traders should not confuse repair with full bullish control. ETH remains in a contested zone below 2033.5-2036, where sellers are still active.The Ethereum Weekly Chart I’m WatchingI am wathcing more than one chart and looking at various data sets. Here is one. IMO, above is an excellent example of how technical tools are used to frame market structure rather than predict the future with certainty. Looking at this weekly CME Ether Futures chart, the annotations clearly delineate a framework for identifying where value and liquidity might reside.Here is an educational breakdown of the structural components on this chart, with a specific focus on the mechanics and utility of the Pitchfork. Remember “I am watching” does not mean that price will for sure get there.1. The Pitchfork (Andrews’ Pitchfork)The dominant overlay on this chart is a Pitchfork, a trend-channel tool designed to identify potential median lines of a trend, along with upper and lower boundaries.The Mechanics: A Pitchfork is anchored using three significant pivot points—typically a major high, a major low, and the subsequent high (or vice versa). A median line is drawn through the midpoint of the second and third pivots, originating from the first.The Median Line (The “Magnet”): The core theory behind the Pitchfork is that in a healthy trend, price action will gravitate back toward the median line (the central axis) roughly 80% of the time.Context on this Chart: Notice how the price is currently confined to the lower half of the Pitchfork (the blue-shaded zone). The fact that the price has consistently failed to rotate back up to the central median line indicates underlying structural weakness. The market doesn’t have the momentum to reach the “mean” of the projected channel.The Boundaries: The outer parallel lines (the edges of the green and blue zones) act as dynamic support and resistance. Right now, the price is drifting downward, grinding against that lower boundary line, waiting for either a structural breakdown or a mean-reverting bounce.2. Confluence and The 1860 – 1915 Support ZoneThe chart highlights a yellow demand box between 1860 and 1915. This is where the Pitchfork transforms from an isolated drawing into a high-context framework.Horizontal meets Dynamic: The 1860-1915 zone represents static, horizontal market structure—historical areas where buyers previously found value, trapping supply and reversing the price.The Confluence Factor: If the price continues its current trajectory, it will intersect the 1860-1915 horizontal support at the exact same time it touches the lower descending parallel of the Pitchfork. This creates a “confluence zone.”Why it Matters: Institutional algorithms and discretionary traders both watch these intersections. It is an area where risk is clearly defined. A trader knows immediately if the thesis is wrong (e.g., a daily or weekly close below the Pitchfork and the yellow box invalidates the support).3. The Reality of Technical ToolsAs noted in the chart’s premise, no indicator is magic. The Pitchfork does not force the price to bounce at the lower parallel, nor does the yellow box act as a trampoline.Technical tools are simply visual representations of market geometry and historical volume behavior. They are best used to answer the question: “If the price reaches this specific area, is the risk-to-reward ratio asymmetrical enough to justify an execution?” They provide the context for where to zoom in on lower timeframes to read the actual order flow and see if buyers are stepping up to the bid.Why did ETH futures stop falling near 1968-1973?ETH stopped falling near 1968-1973 because aggressive sellers began losing downside efficiency, while buyers repeatedly absorbed pressure around the same support floor.The selloff into the 1973-1968 area was not simply a clean continuation lower. Several key bars showed large volume, but only limited negative delta. That means sellers were still active, but they were not getting the same reward in price movement.This is important for order flow traders. When price falls aggressively but delta does not confirm clean downside continuation, it can signal seller exhaustion, passive buying, or both.The support sequence became clearer when ETH retested the lower zone, printed the true low at 1968, and then rejected it quickly. That rejection turned 1968-1973 into the main tactical floor.What does the 2000 level mean for ETH futures?The 2000 level is now the tactical repair line for ETH futures.This level matters because the strongest bullish impulse bar built value around the 2000 area. After ETH defended the 1968-1973 floor, buyers pushed price higher with strong volume and the strongest positive delta

Italy inflation continues to push up in May, core prices nudge higher as well
CPI +3.2% vs +3.2% y/y expectedPrior +2.7%HICP +3.3% vs +3.2% y/y expectedPrior +2.8%The initial estimates indicate that inflation pressures in Italy continued to push up in May. The jump as it was in April owes much to a further increase in energy prices but there was also an acceleration in both goods and services inflation too.Looking at the breakdown, prices of non-regulated energy products were up 12.6% compared to May last year (previously 9.6% in April). Meanwhile, prices for regulated energy products were up 5.8% compared to the same month last year (previously 5.3%).Meanwhile, goods prices also jumped up to 3.5% (previously 3.1%) while services prices moved up to 2.8% (previously 2.4%).Overall, that sees core annual inflation also push up to 1.8% in May – that is up from 1.6% in April. So, this will be a key spot to watch in case the trend continues in the months ahead as energy price inflation becomes more embedded into other key categories.The Italy report above fits the theme from earlier in the day with the French and Spanish inflation numbers. The only one to have bucked the trend so far on the day is Germany. This article was written by Justin Low at investinglive.com. 🔗 Source 💡 DMK Insight Italy’s inflation hitting 3.2% is a wake-up call for traders: energy prices are driving costs higher. With the CPI and HICP both exceeding expectations, this could signal a tightening of monetary policy from the European Central Bank. Traders should be on alert for potential interest rate hikes, especially if inflation continues to rise. This situation might also affect the euro, which could see volatility against the dollar and other currencies. Keep an eye on energy stocks and commodities, as they may react strongly to these inflation figures. The real story is how this inflation data could ripple through the broader European economy, impacting everything from consumer spending to corporate earnings. Watch for the ECB’s next moves and any comments from officials regarding inflation. If inflation persists, we could see the euro testing key resistance levels, making it crucial for traders to monitor these developments closely. 📮 Takeaway Monitor ECB signals on interest rates as Italy’s inflation rises; key resistance levels for the euro could be tested soon.
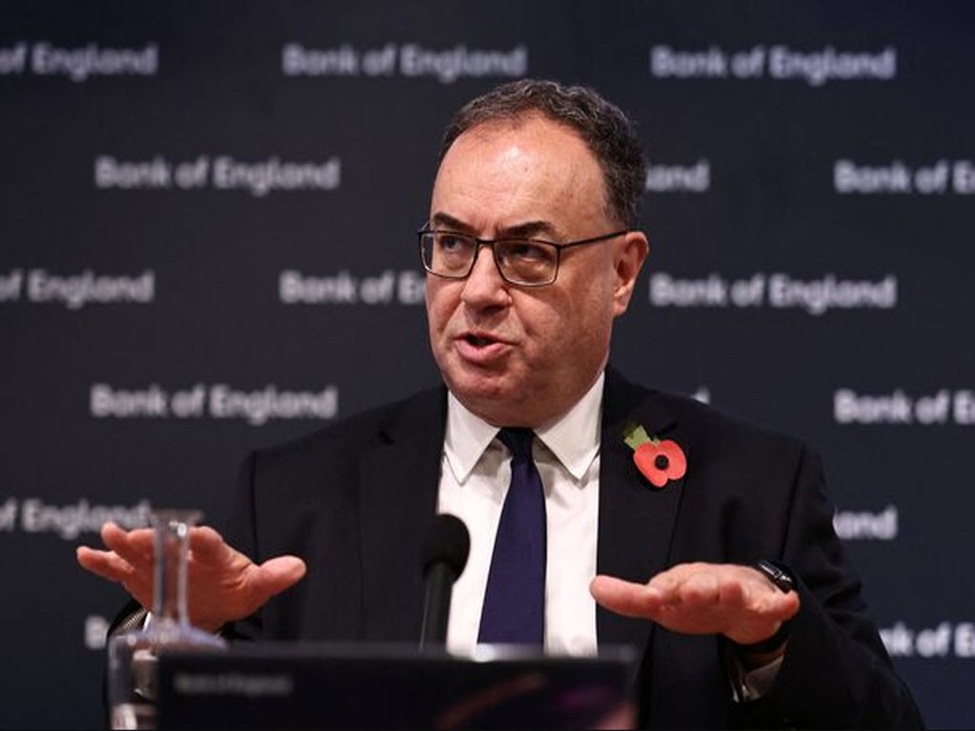
BOE governor Bailey: We have already tightened policy by taking rate cuts off the table
We have to monitor the situation in the Middle EastNeed to see how it affects the UK economy and inflation very closely, and adjust policy as requiredIn having taken expected rate cuts off the table for now, we have already tightened policy considerablyThat is in response to the shock relative to what had been expected by marketsEconomic weakness and uncertainty surrounding the war means tolerating temporarily above target inflation is an appropriate way to approach the policy tradeoffHowever, that tolerance would weaken if signs of second-round effects begin to emergeOn the headline remark, he’s not wrong. That being said, the opposite is also true. With markets now leaning more towards pricing in hawkish steps by the BOE, not raising interest rates this year will end up loosening monetary policy instead. So, there’s that for Bailey & co. to consider.Much like all major central banks right now, the BOE also wants to play for optionality for as long as they can get away with it. Policymakers all want to wait to see how the US-Iran conflict will change next and they will be hoping for more clarity when an agreement is eventually announced. However, that is not to say that the war will end and the Strait of Hormuz will be reopened immediately. In fact, the reality of the situation may be far from that.The BOE for now looks to be putting off a rate hike next month but market pricing suggests that the central bank will have to take action at some point closer to the summer. Traders are pricing in ~32 bps of rate hikes currently by year-end. This article was written by Justin Low at investinglive.com. 🔗 Source 💡 DMK Insight The geopolitical tensions in the Middle East are more than just headlines—they’re potential game-changers for UK monetary policy. With the Bank of England signaling a pause on rate cuts, traders should be wary of how inflation expectations might shift if the situation escalates. If oil prices spike due to conflict, we could see inflationary pressures rise, forcing the BoE to reconsider its current stance. This could impact GBP pairs significantly, especially against the USD, which is often seen as a safe haven in turbulent times. Keep an eye on key inflation metrics and any comments from the BoE, as they could signal a shift in sentiment. On the flip side, if tensions ease, we might see a rebound in risk appetite, which could strengthen the pound. Watch for any major developments in the Middle East and their direct impact on UK economic indicators, particularly in the coming weeks. 📮 Takeaway Monitor UK inflation data closely; any spike could force the BoE to rethink its rate strategy, impacting GBP pairs significantly.
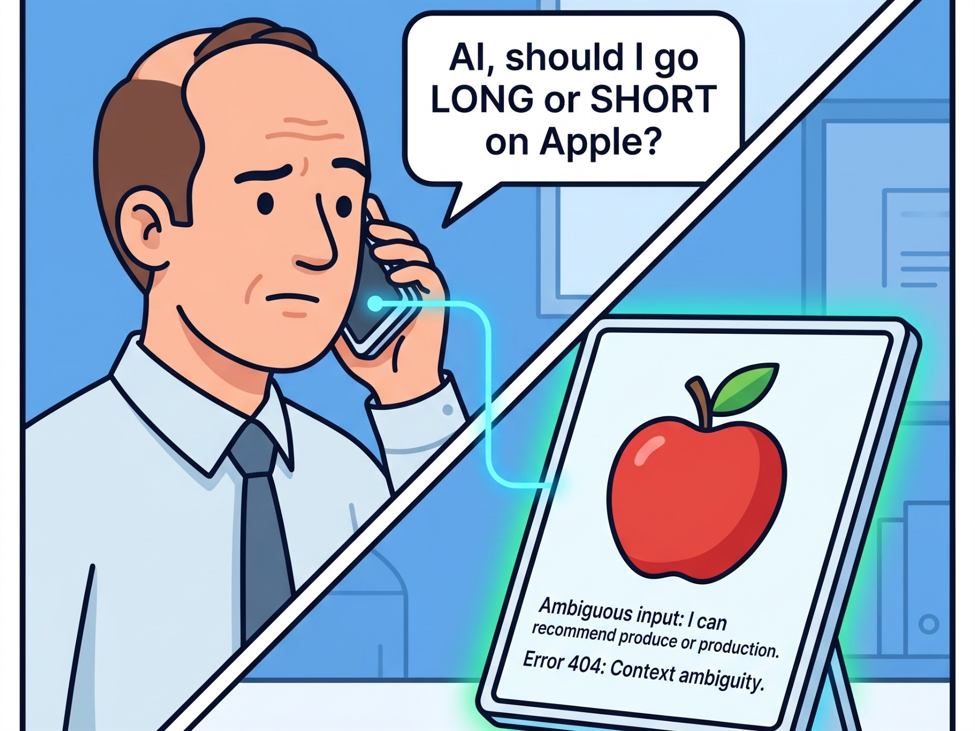
Investor: "AI, should I go long or short on Apple?"
Investor: “AI, should I go long or short on Apple?” AI: “Hold on, querying a secondary AI.” Investor: “Wait, where does that AI get its data?” AI: “From an open-source model.” Investor: “And what is the open-source model trained on?” AI: “The latest forecasts from a top Wall Street analyst.” Investor: “And what is the analyst using for his forecast?” AI: “Me.”Joke invented by It.ai and written by ai. Smile at your own risk. This article was written by Itai Levitan at investinglive.com. 🔗 Source 💡 DMK Insight The reliance on AI for trading decisions is a double-edged sword, especially when the data source is open and potentially unreliable. Traders need to be cautious about the quality of the information driving their strategies. If the AI is pulling from an open-source model based on Wall Street forecasts, it might miss critical nuances or market sentiment shifts that aren’t captured in those predictions. This could lead to misguided long or short positions on stocks like Apple, especially if the broader market is reacting to macroeconomic indicators or earnings reports that the AI isn’t accounting for. Look for volatility in tech stocks, particularly around earnings announcements or economic data releases. If Apple’s price starts to breach key support or resistance levels, that could signal a shift in sentiment worth acting on. Keep an eye on how the market reacts to upcoming tech earnings; a surprise could lead to significant price movements. Traders should also monitor the performance of related tech stocks, as they often move in tandem with Apple, providing additional context for decision-making. 📮 Takeaway Watch for key support and resistance levels in Apple; a break could signal a strong trading opportunity, especially around earnings announcements.
X Open Hub Transitions to XTB Institutional Ahead of iFX EXPO 2026
Corporate restructuring frequently involves sweeping operational shifts. X Open Hub takes a different approach, transitioning to the name ‘XTB Institutional.’ The rebranding serves a specific function: it aligns the B2B liquidity provider directly with the parent company. A clear connection to XTB Group provides immediate recognition regarding financial backing and corporate governance. The underlying business model continues without alteration. Existing clients experience their trading infrastructure without any planned disruptions. The objective centres on clarity. Institutional clients need absolute certainty regarding the entities handling their order flow. A unified corporate identity removes unnecessary complexity from the due diligence process.Maintaining focus on multi-asset liquidityXTB Institutional maintains the same core offering previously provided under the X Open Hub banner. The company delivers institutional-grade multi-asset liquidity to a global client base. Brokers retain access to more than 5,000 instruments across key asset classes. These classes include forex, commodities, indices, and equities. The infrastructure supports fast trade execution during all market conditions. Reliable pricing feeds remain essential for high-volume trading desks. The technology stack ensures transparent transactions for professional traders. The B2B focus stays firmly on delivering scalable execution solutions. Execution speed dictates success for retail brokerages passing flow to institutional partners. Low-latency environments prevent slippage during news events and high-volatility sessions. The established infrastructure handles high trading volumes without compromising performance.Benefiting from strong corporate governanceChoosing a liquidity provider involves significant due diligence. C-level executives and heads of dealing evaluate counterparties based on regulatory compliance and operational resilience. Operating as XTB Institutional instantly communicates a high level of corporate maturity, and the backing of a publicly traded entity offers reassurance to potential institutional partners. The XTB Group brings extensive experience in global financial markets. The rebranded division leverages these organisational resources while maintaining an exclusive focus on B2B services. Banks require confidence in the long-term viability of their infrastructure partners. The updated identity reinforces trust in the operational framework. Transparency in financial reporting provides an additional layer of security for professional market participants. The parent company ensures strict adherence to international regulatory standards across all divisions, supported by the governance, reporting standards and regulatory experience of XTB Group. Seamless continuity for existing partnersThe transition to XTB Institutional involves no modifications to legal structures. Client agreements remain fully effective under the current terms, and regulatory arrangements continue uninterrupted. Existing partners will notice no difference in their daily operations. The execution quality stays at the same rigorous standard. Transparency in pricing and trade routing remains a core priority. “The move to XTB Institutional reflects a natural evolution of our business. Our core offering remains unchanged, but the new identity allows us to communicate more clearly who we are: an institutional liquidity and execution brand backed by the strength, experience, and governance of XTB Group. iFX EXPO International 2026 will be an important opportunity for us to present this new chapter to partners, brokers, and industry participants,” says Michal Copiuk, CEO.Engaging the B2B Sector in CyprusIndustry professionals gather regularly to discuss market developments and build strategic partnerships. iFX EXPO International 2026 in Limassol serves as a primary meeting point for brokers and liquidity decision-makers. The upcoming spring event provides an ideal setting to introduce the XTB Institutional identity in person. The expo offers a direct channel for presenting the refreshed brand to the B2B community. Face-to-face conversations help establish the trust necessary for long-lasting institutional relationships. Market participants face constant challenges regarding market depth and pricing stability. The discussions will highlight methods for improving operational efficiency. The expo allows the company to demonstrate an ongoing commitment to the institutional sector, and business development teams are ready to outline the benefits of partnering with an experienced liquidity provider. Product specialists will be available to analyse specific execution requirements and suggest tailored configurations.A clear path forward for institutional clientsThe transition marks a definitive step forward in corporate communication. The brand now accurately reflects the maturity of its operations, while the focus remains squarely on supporting the growth of brokers and banks. The alignment with XTB Group provides a solid foundation for future development. Long-term partnerships depend on reliability and clear communication, and the updated corporate identity delivers both elements effectively. The leadership team looks forward to discussing these developments with industry peers throughout the year.Connect with the team in LimassolMeet X Open Hub’s team in Limassol to discuss institutional liquidity and execution solutions. Visit us at booth #31 during iFX EXPO International 2026 to learn more about the upcoming transition to XTB Institutional. Learn more about X Open Hub’s current liquidity offering at xopenhub.pro/liquidity-provider/. The new XTB Institutional website will be available as part of the official rebrand rollout.About X Open HubX Open Hub is an institutional liquidity and execution provider serving brokers, banks, and professional market participants. As part of XTB Group, the company provides multi-asset liquidity across 5,000+ instruments, supporting institutional partners with broad market access, execution quality, transparent pricing, and reliable trading infrastructure. X Open Hub’s offering is designed for B2B clients seeking scalable liquidity solutions backed by the experience, governance, and international presence of XTB Group. This article was written by IL Contributors at investinglive.com. 🔗 Source 💡 DMK Insight Rebranding as ‘XTB Institutional’ isn’t just a name change; it signals a strategic pivot aimed at enhancing credibility in the B2B liquidity space. This move could attract institutional clients looking for stability and trust, especially in a market where transparency is paramount. By aligning closely with the XTB Group, they’re leveraging established brand equity to reassure potential partners about financial backing and operational reliability. For traders, this could mean increased liquidity and potentially tighter spreads in the forex market as XTB Institutional positions itself to compete more aggressively. If they succeed in attracting more institutional clients, we might see a ripple effect across related assets, particularly in forex pairs where XTB has a significant presence. Keep an eye on how this rebranding impacts their trading volumes and market share over the next few months, as these metrics will be crucial indicators of their success. However,
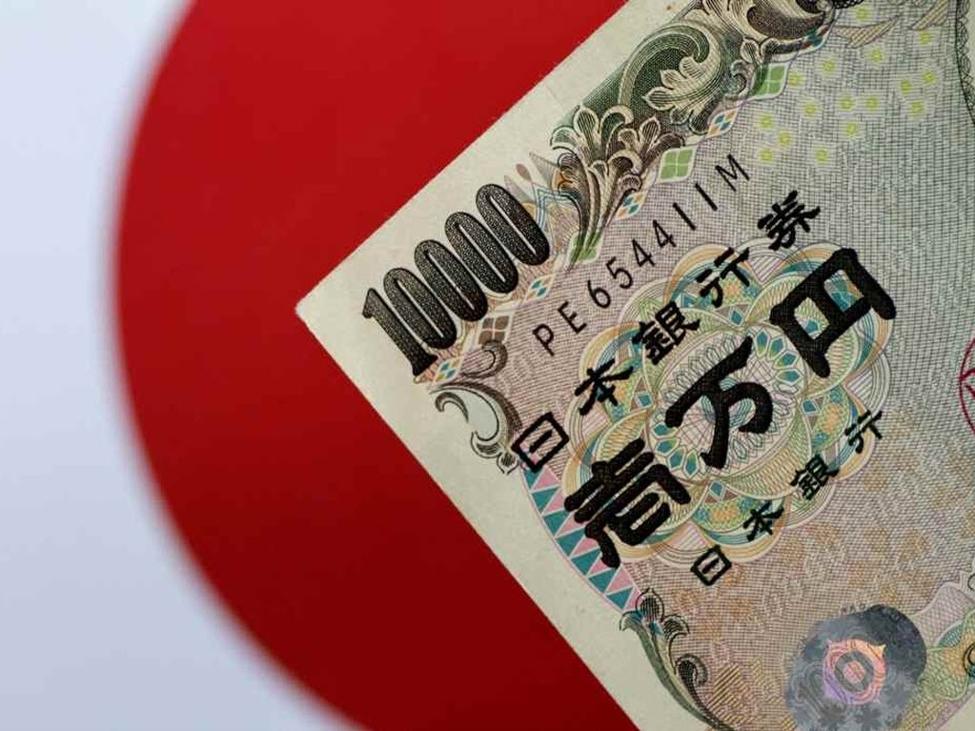
Japan spent ¥11.7 trillion on foreign exchange interventions in the past month
That’s a whopping figure as it is roughly equivalent to $73.4 billion in dollar terms. When compared with the previous intervention moves in 2022 and 2024, the size of this one beats out any of the singular period during those years. The total spent on interventions in 2024 is still more, with that being roughly $98 billion. However, that is spread out across April to May and also July during that year.So far, this roughly $73 billion is coming during the course of just a week from the end of April to early May. The chart below points out when those likely points took place:Since then, USD/JPY has almost completely erased the point of the first intervention move back in late April. For now though, traders are still at least reserving caution in not wanting to incur the wrath of Tokyo officials near the 160.00 level. So, there is still some level of respect there.But considering the amount spent by Japan’s ministry of finance, it definitely meant that they did not go easy with regards to the latest intervention move. The fact of the situation is just that the timing is rather poor and that is allowing for markets to push back harder.The first point is that all the fundamental factors since the US-Iran conflict began have been overwhelmingly negative for the yen currency. The second is that the intervention timing was arguably not the best as they did it during a holiday period for Japanese markets in early May.As mentioned at the time:”It might sound counter-intuitive to not want to act during low liquidity periods, but there’s a certain nuance to it. The main thing about intervention isn’t so much so as the money but more so about the signaling. You want enough players in the market to get that signal and amplify it, so as to get the idea that “we shouldn’t mess with the MOF/BOJ”. Otherwise, that signal can get lost in translation if there isn’t enough liquidity follow through. And at the end of the day, it might just be passed off as more noise than an actual leading signal to traders.” This article was written by Justin Low at investinglive.com. 🔗 Source 💡 DMK Insight So, a $73.4 billion intervention is no small potatoes, and here’s why it matters: this is the largest single intervention we’ve seen compared to previous years. Traders need to recognize that such a massive influx can significantly influence market liquidity and volatility, especially in forex markets where currency pairs are sensitive to central bank actions. This intervention could lead to a short-term strengthening of the currency involved, but it also raises questions about the long-term sustainability of such measures. If traders are holding positions based on the assumption that this intervention will stabilize the market, they might want to reconsider as historical precedents show that large interventions can lead to increased volatility in the aftermath. Keep an eye on related assets, particularly those tied to the currency in question, as they may react sharply. Watch for key price levels that could indicate market sentiment shifts—if the currency strengthens initially but then reverses, that could signal a potential sell-off. The next few weeks will be critical as traders digest this news and adjust their strategies accordingly. 📮 Takeaway Monitor the currency’s reaction to the $73.4 billion intervention; key levels to watch will emerge in the coming weeks.
Fed policymaker Schmid: My primary concern is inflation, which is too hot
My primary concern is inflation, which is too hot and has been above target for too longNow is not the time to let down our guardUS economy is less exposed to energy shock relative to the pastBut I would place little shock in assuming that recent inflation surge is transitoryFed must signal commitment to lowering inflationThe main focus is on getting inflation back to the 2% targetMost economic indicators suggest continued steady growthBelieves that the labour market is in balance, notwithstanding the potential disruptions of AIThere is some evidence that AI is depressing hiring but it is not driving firingWell, Schmid isn’t a voting member on the FOMC committee this year. So, his remarks will not bear as much weight. However, they are still worth taking note of as they do reflect the wider view of how the central bank is treating policy at the moment.There’s definitely a more hawkish leaning starting to develop but we’ll have to see how Warsh wants to steer the conversation in the months ahead.For now at least, traders are seeing the potential for a rate hike late in the year. Fed funds futures point to ~15 bps of rate hikes priced in by year-end and that signals a more hawkish tilt compared to recent weeks, as worries about inflation continue to permeate across broader markets. In particular, the drive higher in bond yields reflect caution and traders are certainly mirroring that when it comes to Fed pricing. This article was written by Justin Low at investinglive.com. 🔗 Source 💡 DMK Insight Inflation’s persistence is a red flag for traders, signaling potential volatility ahead. With inflation remaining above target, the Fed’s cautious stance could impact interest rates and market sentiment. Traders should keep an eye on economic indicators like CPI and PCE, as these will guide Fed policy and influence asset prices. If inflation continues to surprise to the upside, expect heightened volatility in equities and bonds, particularly in sectors sensitive to interest rate changes. Additionally, the Fed’s approach could ripple through the forex market, affecting USD pairs as traders adjust their expectations for rate hikes. Here’s the thing: while some may view the inflation surge as temporary, the Fed’s language suggests a more prolonged concern. If inflation doesn’t cool off, we could see a shift in market dynamics, especially if the Fed decides to act more aggressively than anticipated. Watch for key inflation reports in the coming weeks, as they could set the tone for the markets moving forward. 📮 Takeaway Keep an eye on upcoming CPI and PCE reports; if inflation stays high, expect increased volatility in equities and forex markets, particularly USD pairs.