Bitcoin
  Ethereum
  Tether
  BNB
BNB  XRP
XRP  USDC
USDC  Solana
  TRON
TRON  Figure Heloc
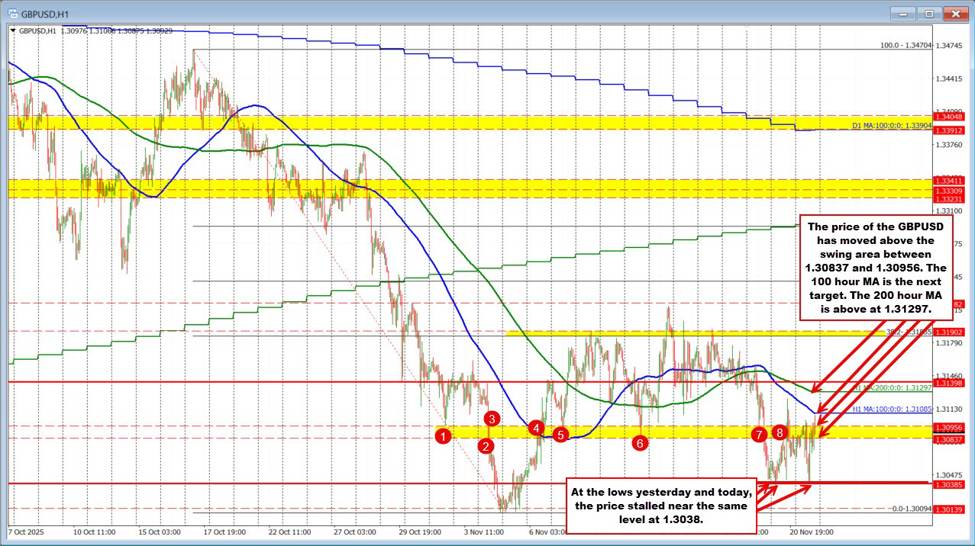
The GBPUSD is waking up and trying to take more control with a push to the upside, but there is work to be done.Looking at the hourly chart of the GBPUSD, the pair has been battling back and forth, trying to find a direction. We established a nice double bottom floor at the 1.3038 level—holding yesterday and testing it again today before rotating higher. That level is now the definitive line in the sand for the sellers; as long as we stay above that, the wash-out remains on hold.For the last several sessions, the price has been capped by a sticky “swing area” between 1.30837 and 1.30956 (highlighted in yellow – s red numbered circlesee ). You can see on the chart (Red circles 1 through 8) how many times price interacted with this zone—acting as both support and resistance. The price has now broken above that swing area. Buyers are making a play.However, for the buyers to keep “winning,” they need to turn that old ceiling into a new floor. Staying above 1.30837 is close support now.On the topside, the next target comes against the 100 hour moving average (blue line at 1.31085). So far the price has stalled against that level keeping the sellers “in play” and in more control. Getting above the 100 hour moving average would have traders next targeting the 200 hour moving average. That level comes in at 1.31297 Ultimately, if the buyers are to take more control, they need to get above both those moving averages and stay above those moving averages. So far, the sellers are leaning against the 100 hour MA.
This article was written by Greg Michalowski at investinglive.com.
💡 DMK Insight
The GBPUSD is showing signs of life with a potential double bottom, but traders need to stay cautious. The recent push to the upside indicates a shift in momentum, yet the pair has been stuck in a tight range, suggesting indecision among traders. A confirmed breakout above recent resistance levels could signal a stronger bullish trend, but if it fails, we might see a quick reversal. Keep an eye on the hourly chart for confirmation of this double bottom pattern—if it holds, it could lead to a rally towards key resistance levels. However, if the price retraces below the double bottom, that could trigger stop-losses and further selling pressure. Watch for any economic data releases that could impact the GBP or USD, as these could add volatility. Also, monitor the 1.2500 level closely; a decisive move above this could attract more buyers, while a drop below 1.2400 might signal a bearish shift.
📮 Takeaway
Watch the 1.2500 resistance level closely; a breakout could lead to a bullish rally, while a drop below 1.2400 might trigger selling pressure.