Bitcoin
  Ethereum
  Tether
  XRP
XRP  BNB
BNB  USDC
USDC  Solana
  TRON
TRON  Figure Heloc
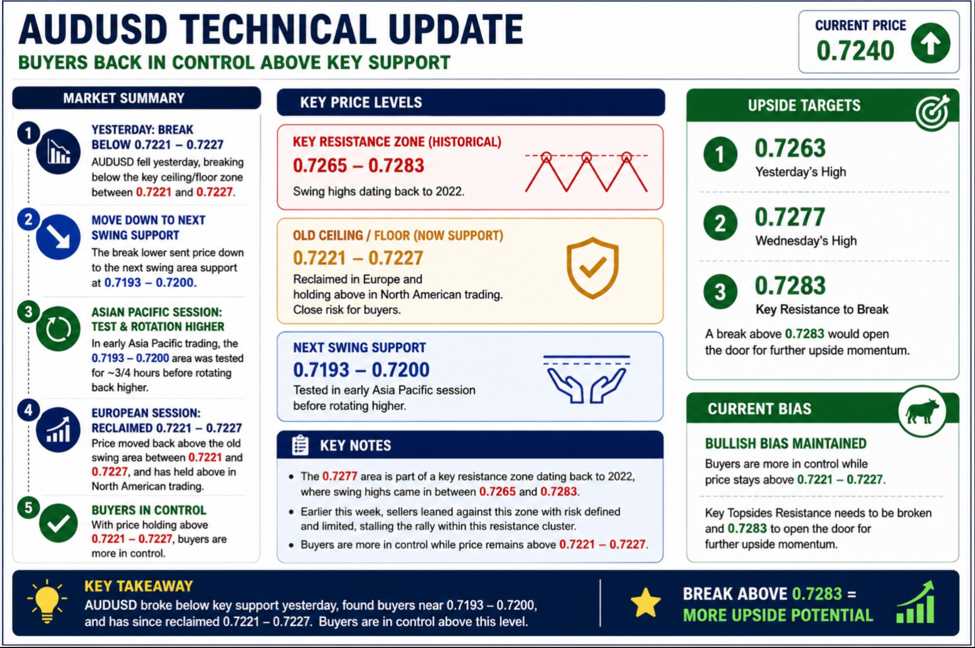
The AUDUSD fell sharply yesterday, breaking back below a key ceiling/floor zone between 0.7221 and 0.7227. That bearish break helped push the pair down toward the next swing area support between 0.7193 and 0.7200. In early Asian-Pacific trading, buyers leaned against that support zone for several hours, helping stabilize the price before the pair rotated back to the upside.During the European session, the AUDUSD reclaimed the former swing area between 0.7221 and 0.7227, and importantly, the price has been able to stay above that zone into North American trading. That move back above the old resistance area shifts the short-term bias back in favor of the buyers, with the pair now trading near 0.7240.The next upside targets are the highs from earlier in the week. Yesterday’s high reached 0.7263, while Wednesday’s high extended to 0.7277. Recall from yesterday’s post that the 0.7277 area represents a key resistance zone dating back to 2022, where prior swing highs came in between 0.7265 and 0.7283. Earlier this week, sellers leaned against that historical ceiling with risk defined and limited, helping stall the rally within that resistance cluster.For now, buyers are back more in control while the price remains above the 0.7221–0.7227 area. A break above the key 0.7283 resistance level would open the door for further upside momentum and increase the bullish bias going forward.
This article was written by Greg Michalowski at investinglive.com.
💡 DMK Insight
The AUDUSD’s drop below 0.7221-0.7227 is a crucial signal for traders: This bearish break not only indicates a loss of bullish momentum but also sets the stage for a potential test of the next support zone at 0.7193-0.7200. Given the recent price action, traders should be cautious about long positions until there’s a clear reversal signal. The fact that buyers are attempting to stabilize around this support suggests a battle between bulls and bears, but if this level fails, we could see a more aggressive sell-off. Look for volume spikes or a shift in momentum indicators like RSI or MACD to gauge whether this support holds. If it breaks, the next psychological level to watch could be 0.7150, which might trigger further downside pressure. On the flip side, if buyers reclaim the 0.7221-0.7227 zone, it could signal a short-term reversal, making it a critical area to monitor in the coming sessions.
📮 Takeaway
Watch the 0.7193-0.7200 support zone closely; a break below could lead to further declines, while a bounce could signal a potential reversal.