Bitcoin
  Ethereum
  Tether
  XRP
XRP  BNB
BNB  USDC
USDC  Solana
  Figure Heloc
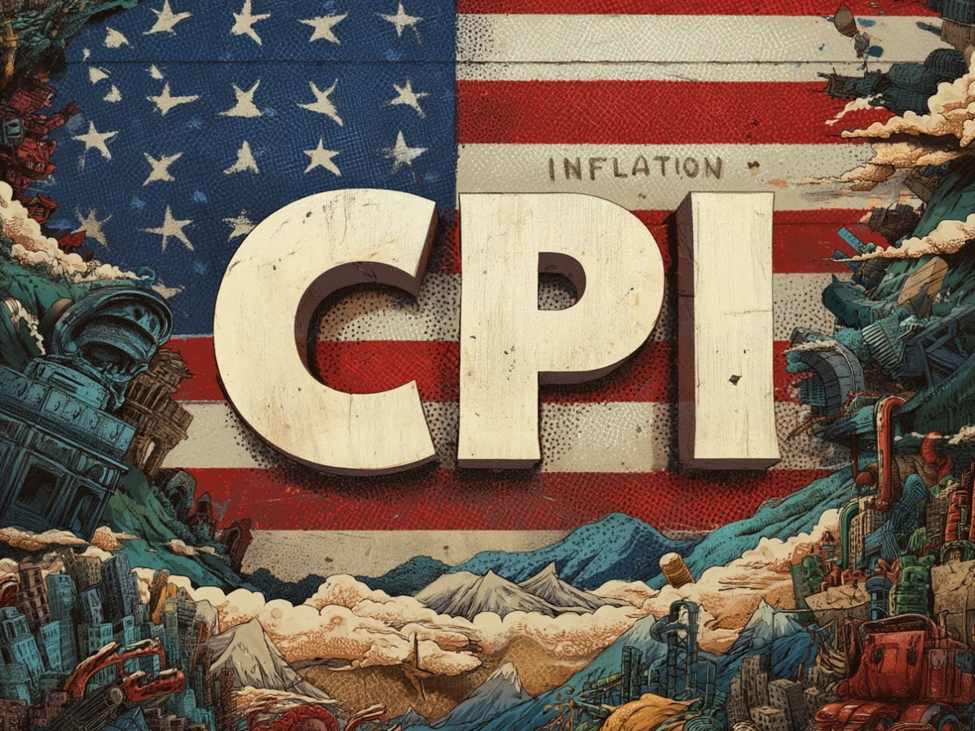
Prior was +2.4% y/yCPI 0.9% m/m vs +0.9% expectedPrior +0.3% m/mNon-seasonally adjusted, unrounded +1.05% vs +0.47% priorCore CPI 2.6% vs 2.7% y/y expectedPrior core 2.5%Core CPI m/m +0.2% vs +0.9% expectedPrior core +0.2%Real weekly earnings -0.9% vs +0.1% priorCPI Supercore M/M +0.18% vs +0.350% priorCPI Supercore Y/Y 3.14% vs 2.746% priorEnergy index +10.2%The economists did a good job of forecasting the rise in energy prices. Gasoline prices were up 21.9% in this report but note that US gasoline prices are up 40% compared to pre-war so there is still more in the pipeline. Of course, with a ceasefire that will reverse over time.Fed pricing continues to show no moves this year. There was some modest USD weakness on the release but it’s mostly faded. The lower core number is likely behind the drop in the dollar.Consumer price inflation has been on a gradual but uneven path lower since peaking above 9% in mid-2022. The Federal Reserve’s aggressive tightening campaign succeeded in pulling headline CPI back below 3% by late 2024, but the final stretch toward the 2% target has proven stubborn, particularly in services.Shelter costs, which make up roughly a third of the CPI basket, have been the single largest contributor to above-target inflation. Although private-sector rent measures have been cooling for over a year, the BLS methodology captures lease renewals with a significant lag. Most economists expect shelter disinflation to continue feeding through, but the pace has repeatedly disappointed.The March report marks a sharp departure from the benign readings of recent months, driven almost entirely by energy. Economists largely nailed the call — gasoline surged 21.2% in the month, the largest monthly increase since the series began in 1967, as the Iran conflict sent crude prices spiking. But the pipeline isn’t empty. US gasoline prices remain roughly 40% above pre-war levels, meaning further pass-through into upcoming reports is likely unless the ceasefire holds and prices retrace. If it does hold, that energy shock will reverse over the coming months, but with a lag.Underneath the energy noise, the core picture was encouraging. Core CPI rose just 0.2% for the second straight month, and the supercore measure — stripping out food, energy, and shelter — printed a soft 0.18%, well below February’s 0.350%. That deceleration will be welcome at the Fed, though policymakers will want to see whether the energy shock bleeds into broader prices before drawing conclusions.
This article was written by Adam Button at investinglive.com.
💡 DMK Insight
Today’s CPI data is a mixed bag, and here’s why that matters for traders: inflation pressures are easing, but not as much as hoped. The headline CPI came in at 0.9% m/m, matching expectations, but core CPI slightly missed at 2.6% y/y versus the expected 2.7%. This divergence suggests that while inflation is stabilizing, underlying pressures remain. Traders should watch how this affects Fed policy, especially with real weekly earnings down 0.9%. If the Fed continues to signal a hawkish stance despite these numbers, we could see volatility in both equities and forex markets. Key levels to monitor include the S&P 500’s recent support around 4,200 and resistance near 4,300. A break below 4,200 could trigger further selling. On the flip side, if the market interprets this data as a sign of a potential pause in rate hikes, we might see a rally in risk assets. Keep an eye on the upcoming Fed meeting for any shifts in tone. The immediate focus should be on how these inflation figures impact market sentiment in the next few trading sessions.
📮 Takeaway
Watch the S&P 500 around 4,200; a break below could signal further downside, while a rebound might suggest a bullish sentiment shift.