Bitcoin
  Ethereum
  Tether
  XRP
XRP  BNB
BNB  USDC
USDC  Solana
  Figure Heloc
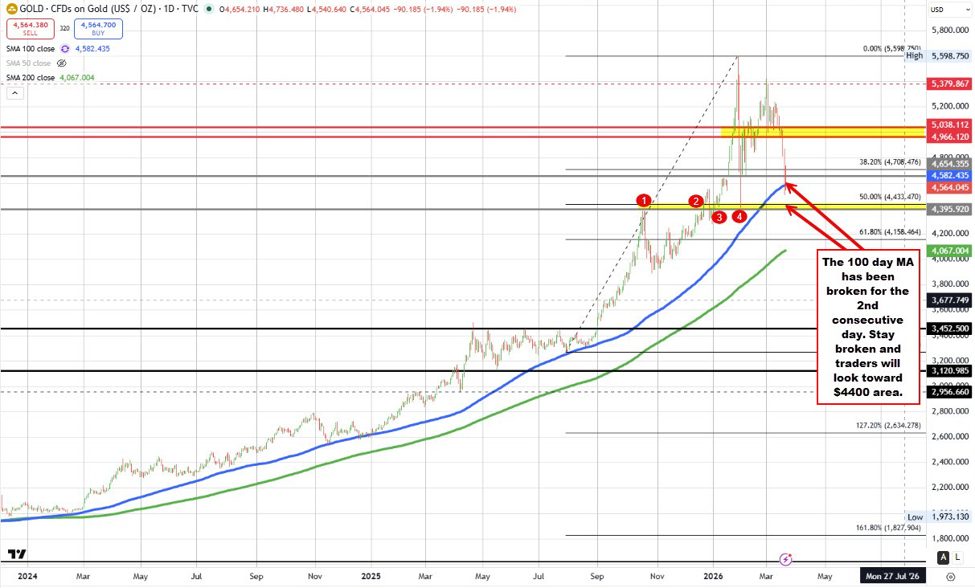
The price of gold is under notable pressure today, falling sharply by about $90, or -1.93%, to trade near the $4565 level. That decline has pushed the price back below its 100-day moving average at $4582.44—a key technical level that has served as an important barometer for trend direction over the past several months.Looking back to yesterday’s price action, gold also dipped below that same 100-day moving average but managed to recover into the close. That late-session rebound helped the metal avoid its first daily close below the 100-day moving average since December 2024, reinforcing the idea that buyers were still willing to defend that level. However, today’s renewed break—and the inability (so far) to reclaim it—suggests that downside momentum may be starting to build, with sellers gaining more control in the near term.From a technical perspective, staying below the 100-day moving average (close risk now) keeps the bias tilted to the downside. If the price cannot quickly move back above that level, traders will begin to look toward lower support zones for the next targets. The next key area comes in near the $4400 region, which represents an important psychological level as well as a zone of prior price interaction.More specifically, the 50% midpoint of the move higher from the last major test of the 100-day moving average back in August 2025 comes in at $4433. That level adds a layer of technical significance within the broader $4400 area. Just below that, a swing low from late January sits near $4395, which also aligns with prior swing highs going back to October—creating a cluster of support that traders will be watching closely.In short, the break below the 100-day moving average shifts the near-term focus to the downside, with the $4433 to $4395 area representing a key support zone. Holding above that region could stabilize the market and invite buyers back in, but a sustained move below would likely open the door for a deeper correction as bearish momentum builds.
This article was written by Greg Michalowski at investinglive.com.
💡 DMK Insight
Gold’s sharp drop below $4582.44 is a critical signal for traders right now. This decline not only breaks a key technical level but also raises questions about market sentiment amid broader economic pressures. With gold trading near $4565, the loss of the 100-day moving average could indicate a shift towards bearish sentiment, prompting traders to reassess their positions. If this trend continues, we might see further selling pressure, potentially targeting the next support level. Watch for how the market reacts in the coming days—if gold fails to reclaim that moving average, it could lead to cascading effects across commodities and related assets like silver or mining stocks. On the flip side, if buyers step in and push prices back above $4582.44, it could signal a buying opportunity for those looking to capitalize on a potential rebound. Keep an eye on volume and momentum indicators to gauge the strength of any recovery attempt.
📮 Takeaway
Traders should monitor gold’s ability to reclaim the $4582.44 level; failure to do so could lead to further declines.