Bitcoin
  Ethereum
  Tether
  XRP
XRP  BNB
BNB  USDC
USDC  Solana
  Dogecoin
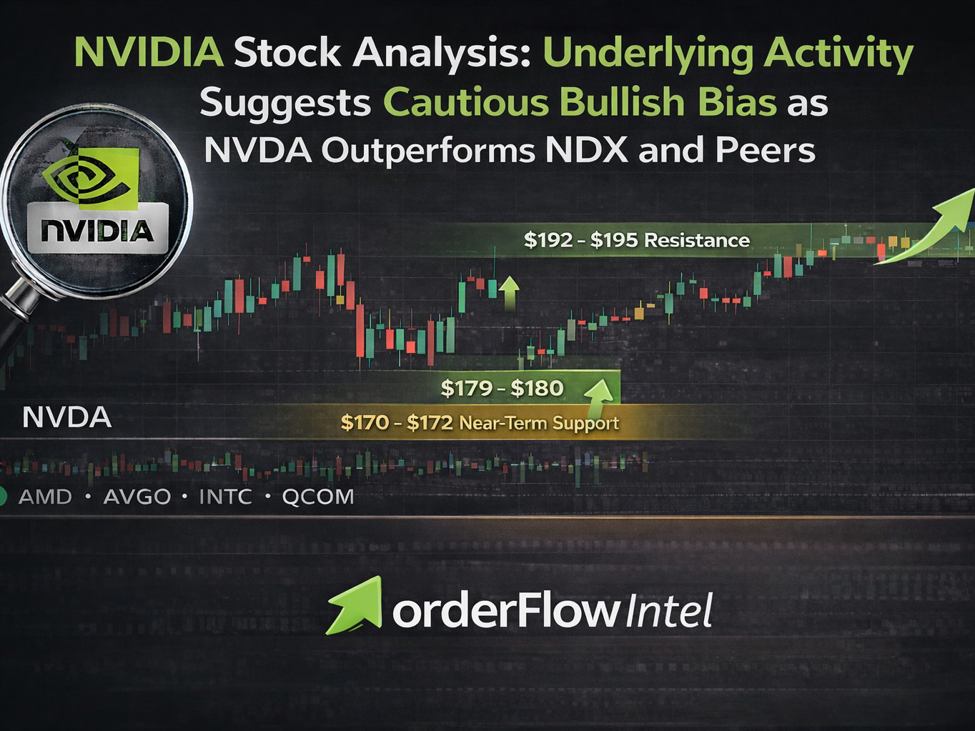
NVIDIA stock analysis: underlying activity suggests cautious bullish bias as NVDA outperforms NDX and peersNVIDIA (NVDA) is trading near ~$188 after rebounding sharply from the ~$170 area, while the Nasdaq 100 (NDX) remains in a broader repair phase below recent highs near ~$26,000.Technology shares have experienced volatility, but NVDA has shown relative resilience versus both the index and several semiconductor peers including AMD, AVGO, INTC, and QCOM.The key question now: is this leadership sustainable, or is it a temporary bounce within a larger consolidation?What underlying activity for NVDA stock suggestsRecent participation dynamics show a clear shift in tone.When NVDA tested the ~$170–$172 area, selling pressure failed to produce meaningful follow-through. Price stabilized quickly, suggesting that demand was willing to absorb downside attempts rather than allowing a cascade lower.On the rebound toward ~$190–$195, supply has become more responsive. Rallies have encountered sellers, but not with the same urgency seen during the prior decline. This creates a constructive but incomplete picture: buyers appear active on pullbacks, yet upside still needs stronger acceptance above resistance to confirm renewed momentum.In contrast, when looking at the close peers of NVDA:AMD continues to behave more like a “sell-the-rally” structure below ~$210–$220.QCOM is attempting recovery from ~$132–$133 but still faces overhead supply near ~$145–$150.INTC shows balanced behavior between ~$43–$44 support and ~$47–$48 resistance.AVGO is stabilizing above ~$295–$300 but remains in structural repair below ~$345–$355.Relative to this group, NVDA’s participation quality remains stronger.Longer-term view for Nvidia stock vs recent behaviorFrom a longer-term perspective, NVDA remains in a constructive structure as long as it holds above ~$170–$172.Recent sessions show improving demand, but the stock has not yet decisively accepted higher levels above ~$192–$195. This means the tone is improving, but not aggressively bullish.Meanwhile, the broader NDX must hold above approximately ~$24,400 to prevent renewed index pressure that could spill into even stronger names.Leadership can persist only if the broader market backdrop stabilizes.NVIDIA (NVDA) Consolidates Within Previous Value Area as Point of Control Shifts HigherThe daily chart for NVIDIA (NVDA) highlights two distinct volume profiles, comparing the previous earnings period with the current period since the last earnings report. Key areas to watch for NVDA stockNotably, the value area for the current quarter is entirely contained within the previous quarter’s range, indicating a period of tightening consolidation. However, bullish undertones are evident as the Point of Control (POC) for the current period has migrated upward to approximately $184.75, compared to the previous quarter’s POC of $182.25. Despite this higher concentration of trading volume, the stock faces persistent structural resistance at the Value Area High (VAH), positioned just below the $190.50 mark. Traders will be watching closely to see if NVDA can break through this ceiling or if the VAH acts as a firm rejection point, keeping the asset range-bound.Trading the Point of Control
This tutorial provides a practical breakdown of how to interpret and build strategies around the Point of Control during different market rotations and trendsFor traders and investors monitoring NVDA:Resistance: ~$192–$195Near-term support: ~$179–$180Major support: ~$170–$172NVDA stock options sentiment: what positioning signals add to the pictureRecent options flow provides additional context.Institutional-sized trades represented roughly 37% of notional participation, with retail and professional activity comprising the remainder. Notably, the largest single-leg notional volume came from large institutional trades, with approximately $47M transacted.However, the most significant positive directional exposure came from retail traders, who were net long roughly 204K deltas.At the same time, large institutional positioning showed an on-balance delta reading near -137,663, suggesting some hedging or cautious positioning at higher levels.This combination matters:Retail appears actively leaning long.Institutions are participating heavily in notional terms, but with a more defensive or hedged posture.Upside enthusiasm is present, but not universally aggressive.Options sentiment therefore aligns with the price structure: constructive, but not euphoric.Scenarios for NVDA as it prepared for its earnings on 25 Feb, 2026 (AMC)Bullish scenario for NVDA stockAs long as NVDA holds above ~$179–$180 and demand continues to absorb pullbacks, the path of least resistance remains higher. Sustained acceptance above ~$192–$195 would open the door toward a broader continuation phase.Bearish scenario for NVDA stockIf NVDA begins to accept prices below ~$179 and especially below ~$170–$172, it would suggest that sellers are regaining control. A renewed breakdown in NDX below ~$24,400 would further increase downside risk.Market bias score for NVDA stock: +2 (slightly bullish)A +2 score reflects modest buyer advantage rather than aggressive momentum. NVDA is showing relative strength versus peers and the index, but supply remains present near resistance.This is resilience, not runaway upside.The score would improve with sustained acceptance above ~$195 and continued outperformance versus NDX. It would weaken quickly if price begins accepting below ~$170–$172.What would change the view on NvidiaSustained acceptance below ~$170–$172Clear underperformance versus NDXStrong follow-through selling after failed rallies near ~$192–$195This analysis is intended for educational and decision-support purposes only. It is not financial advice. Markets are inherently uncertain, and all trading and investing decisions carry risk.For real-time trade ideas, follow-ups, and market insights across stocks, indices, commodities, and crypto, check out the investingLive Stocks Telegram channel. Trade ideas are shared for educational purposes only and at your own risk.https://t.me/investingLiveStocks
This article was written by Itai Levitan at investinglive.com.
💡 DMK Insight
NVIDIA’s recent rebound to around $188 is a signal for cautious optimism among traders. The stock’s performance, especially as it outpaces the Nasdaq 100, suggests a potential bullish bias, but the broader market remains shaky. With the NDX hovering below $26,000, traders should be wary of volatility. If NVDA can maintain momentum above $180, it might attract more buying interest, especially from institutional players looking for tech exposure. However, a failure to hold above this level could trigger profit-taking, leading to a pullback. Keep an eye on the upcoming earnings reports and macroeconomic indicators that could influence tech sentiment. The real story is whether NVDA can decouple from the broader market’s repair phase or if it will follow suit. Watch for NVDA’s ability to break decisively above $190, which could signal a stronger bullish trend, while a drop below $180 might indicate a shift in sentiment.
📮 Takeaway
Monitor NVIDIA’s price action around $180; a break above $190 could signal a stronger bullish trend, while a drop below $180 may trigger profit-taking.