Bitcoin
  Ethereum
  Tether
  BNB
BNB  XRP
XRP  USDC
USDC  Solana
  Figure Heloc
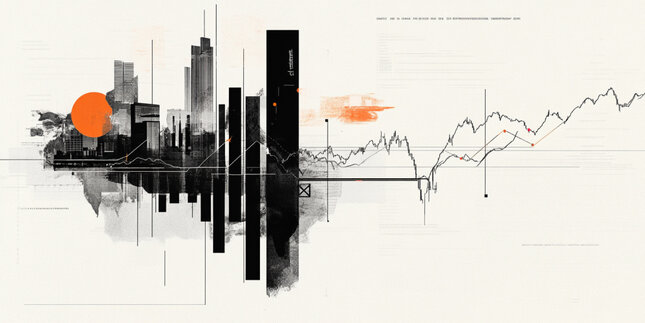
The Nasdaq has been in a roller-coaster ride during the past three weeks. It was going sideways for a couple weeks (Doji candles in rex box) after a double top (orange box) indicated a pause in the huge uptrend (green arrow).
💡 DMK Insight
The Nasdaq’s recent sideways movement after a double top signals potential volatility ahead. Traders should be cautious as this pattern often precedes significant price action. The Doji candles indicate indecision, which could lead to a breakout or breakdown. If the index fails to hold above the recent highs, we might see a pullback, especially if broader market sentiment shifts. Keep an eye on the 13,000 level as a critical support zone; a breach could trigger further selling. Conversely, if it breaks above the double top, it could reignite bullish momentum. Watch for volume spikes as confirmation of any breakout or breakdown, as they will provide insight into market participants’ conviction.
📮 Takeaway
Monitor the 13,000 support level closely; a break could signal a bearish shift in the Nasdaq.