Bitcoin
  Ethereum
  Tether
  BNB
BNB  XRP
XRP  USDC
USDC  Solana
  Figure Heloc
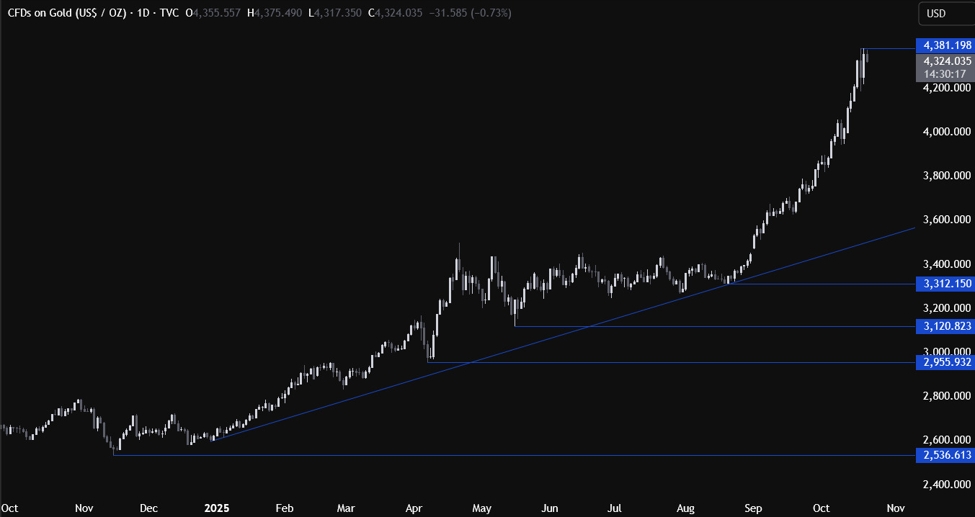
Fundamental
OverviewGold came under some
pressure on Friday despite the lack of bearish catalysts. Maybe, the positive
risk sentiment triggered some profit-taking but overall, the picture hasn’t
changed.The parabolic surge is certainly
making some people nervous but given the lack of bearish catalysts, there’s not
much to challenge the momentum. The US-China drama remains a key market focus but the market is now more certain on some kind of deal. The main risk event this week could be the US CPI on Friday. Although the Fed is more focused on the labour market now, an upside surprise in inflation could still trigger a hawkish repricing in expectations. In the bigger picture, gold
should remain in an uptrend as real yields will likely continue to fall amid
the Fed’s dovish reaction function. But in the short term, a hawkish repricing
in interest rate expectations could trigger a correction. Gold
Technical Analysis – Daily TimeframeOn the daily chart, we can
see that gold managed to recover Friday’s losses and extend into yet another
all-time high before pulling back a bit. The lack of bearish catalysts continues
to keep the bullish momentum intact. This rally went so much parabolic that
it’s basically useless to look at the daily timeframe at the moment, so we need
to zoom in to see some more details. Gold Technical Analysis
– 4 hour TimeframeOn the 4 hour chart, we can
see that the price yesterday couldn’t sustain the breakout above the Friday’s
high. This might turn out to be a double
top in a bigger correction, so we can expect the sellers to step in around
the highs to position for a pullback into the major trendline and increase the
bearish bets on a break below the 4,185 level. The buyers, on the other hand,
will want to see the price breaking higher to invalidate the bearish setup and
pile in for a rally into new highs. Gold Technical Analysis
– 1 hour TimeframeOn the 1 hour chart, we can
see that we have a minor support zone around the 4,280 level where we can also
find a minor upward trendline. That’s where we can expect the buyers to step in
with a defined risk below the support to position for a rally into new all-time
highs. The sellers, on the other hand, will want to see the price breaking
lower to increase the bearish bets into the major trendline. The red lines
define the average daily range for today. Upcoming
CatalystsThe focus remains
on the US-China developments but on Friday we will also get the US CPI report and the US flash PMIs. Watch the video below
This article was written by Giuseppe Dellamotta at investinglive.com.
💡 DMK Insight
Gold’s recent pullback, despite no clear bearish signals, highlights a crucial moment for traders. The current positive risk sentiment could be a double-edged sword; while it might encourage profit-taking, it also suggests that many investors are still bullish on gold’s long-term prospects. This is significant because it indicates that the market is still digesting the recent parabolic rise, and traders should be cautious about entering new long positions without a clear catalyst. From a technical standpoint, keep an eye on the $1,950 support level. If gold can hold above this, it may attract more buyers looking for a dip. Conversely, a break below could trigger further selling pressure, potentially leading to a test of the $1,900 mark. Additionally, monitor the RSI for signs of overbought conditions; if it starts to decline, it could signal a shift in momentum. The broader market context also matters—rising interest rates and inflation concerns could weigh on gold prices if risk sentiment shifts. Traders should stay alert to macroeconomic indicators and central bank announcements that could influence market dynamics. In summary, while the bullish trend remains intact, the current environment calls for a careful approach, balancing risk and reward as market sentiment evolves.
📮 Takeaway
Watch the $1,950 support level closely; a break could signal further downside, while holding above it may attract new buyers amid evolving market sentiment.