Bitcoin
  Ethereum
  Tether
  BNB
BNB  XRP
XRP  USDC
USDC  Solana
  Figure Heloc
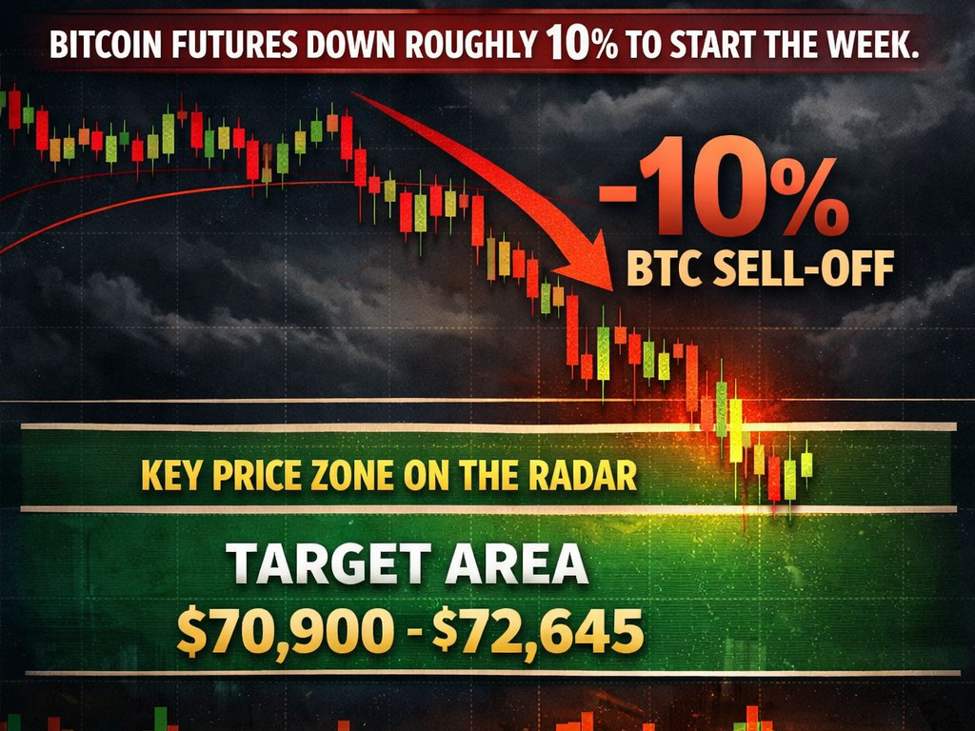
Bitcoin Price Prediction Focuses on $70,900 to $72,645 Support ZoneKey takeaways for crypto traders and investorsBitcoin futures are down roughly 10%, extending a developing bearish structureOrder flow shows sellers in control, with buyers increasingly passiveRecent rebounds lacked acceptance and failed to repair market structureDownside risk remains elevated unless behavior changesThe $70,900 to $72,645 zone is the next key area for technical evaluationEther futures: I am watching the zone of $2110. If and when reached, I will be patiently watching the price reaction.Bitcoin technical analysis overviewBitcoin futures are under pressure to start the week, down roughly 10%, following weakness that developed over the weekend in the 24/7 spot market. From a bitcoin technical analysis perspective, the magnitude of the move is less important than how the decline unfolded.Rather than a sudden panic-driven sell-off, order flow shows that weakness had been building over time. Buyers gradually lost control of key reference levels, while sellers became more effective well before the downside acceleration became obvious on traditional price charts.This type of development often precedes larger directional moves and is a key reason why the broader bitcoin price prediction framework remains cautious.Weekly Market Opening Update: February 2, 2026The trading week has commenced with a defensive tone across major asset classes. As geopolitical premiums shift and industrial demand concerns linger, we are seeing a synchronized move toward volatility, particularly within the commodities and digital asset sectors.Energy: OPEC+ Stability and Fading Risk PremiumsThe crude oil market opened the week on the back foot following the latest policy signals from major producers. Oil opened lower after OPEC+ maintained its March output levels, choosing stability over intervention. This decision comes at a sensitive time; the “Iran risk premium” that had previously propped up prices is beginning to wobble. Without a fresh supply-side catalyst or a resurgence in geopolitical tensions, traders are increasingly focusing on the demand outlook, leading to a soft start for energy benchmarks this Monday.Precious Metals: Volatility Remains the Primary DriverThe safe-haven sector is providing little relief for those seeking calm. Precious metals remain in the spotlight as volatile selling continues, characterized by sharp intraday swings and aggressive liquidations. While gold and silver typically benefit from economic uncertainty, the current “selling begets selling” environment suggests a deleveraging event is underway. Traders should watch for key support levels, as the momentum currently favors the bears in the immediate short term.The Shift to Risk-Off: Crypto Gaps DownThe cautious sentiment in traditional commodities has spilled over—and amplified—within the digital asset ecosystem. Over the weekend and into early Monday, the crypto market experienced a significant gap down, catching many levered participants off-guard.The headline story remains MicroStrategy’s aggressive treasury policy. The recent Bitcoin dip has put MicroStrategy’s strategy marginally underwater, a psychological level that often triggers broader market anxiety. However, for long-term investors, it is important to note that despite the price action, immediate balance sheet risks for the firm remain limited.As Bitcoin and Ethereum struggle to reclaim broken support levels following this morning’s gap, the focus for the remainder of the week will be on whether this is a localized flush-out or the start of a deeper correction across the risk-asset spectrum.Back to Bitcoin Today (So Far)… How the downside structure developedIn the sessions leading into the sell-off, Bitcoin futures repeatedly failed to hold higher levels. Upside attempts became shorter and more fragile, while declines began to extend with noticeably less resistance.This imbalance is a classic early warning signal in technical analysis. When price falls more easily than it rises, it typically reflects deteriorating buy-side liquidity, even if volatility initially remains contained.Order flow confirmed this shift. Selling pressure increasingly met little opposition, and instead of seeing strong demand appear at lower prices, buyers stepped aside, allowing price to drift lower without aggressive liquidation.Why recent rebounds failed in Bitcoin futures todaySeveral intraday rebounds appeared during the decline. On the surface, these moves may have looked constructive, particularly on lower timeframes. However, order flow revealed that these were responsive bounces, not the start of a structural recovery.In practical terms, buying activity during these rallies was short-term and tactical, often driven by short covering rather than conviction. Price failed to achieve acceptance at higher levels, and sellers remained comfortable defending each rebound.From a technical standpoint, this behavior reinforces a bearish bias and suggests that recent upside attempts were corrective rather than trend-changing.Bitcoin price prediction: why the bias remains bearishThe current bitcoin price prediction is not based on a single candle or headline-driven event. Instead, it reflects a gradual deterioration in market structure.Key technical observations include:Selling pressure has become more efficientBuying responses have grown weaker and less persistentPrice continues to trade below key reference levels rather than reclaiming themUntil these conditions improve, downside risk remains elevated and rallies are best treated with caution.Key support zone to watch for Bitcoin futures this week: $70,900 to $72,645From a bitcoin technical analysis standpoint, the $70,900 to $72,645 region stands out as the next major area of interest.If price revisits this zone, the focus should be on market behavior, not predictions:Does selling pressure begin to slow?Does two-way trade emerge instead of one-sided downside?Is there evidence that sellers are meeting sustained demand?Only if price begins to stabilize and absorb selling pressure in this region would the bitcoin price prediction shift toward a potential bullish reversal, whether temporary or more durable.What today’s bitcoin analysis is not suggestingTo avoid common misinterpretations:This is not a recommendation to buy BitcoinThis is not a call to short current pricesThis is not an attempt to identify a market bottomThe goal is to highlight where new technical information is most likely to emerge.What would change the Bitcoin outlookThe bearish bitcoin technical analysis would need to be reassessed if the market begins to show:Sustained stabilization instead of shallow reboundsClear evidence of selling absorptionImproved follow-through on rallies rather than immediate rejectionUntil then, patience remains essential.Bitcoin futures are lower not because of a single catalyst, but due to a gradual breakdown in market structure. Order flow continues to show sellers in control and buyers failing to reassert themselves. From a bitcoin technical analysis and bitcoin price prediction perspective, the $70,900 to $72,645 area is the next key zone to watch for signals, not action.For real-time updates and market context, traders can follow the free InvestingLive Stocks channel on Telegram. https://t.me/investingLiveStocks
This article was written by Itai Levitan at investinglive.com.
💡 DMK Insight
Bitcoin’s current support zone between $70,900 and $72,645 is critical, and here’s why: With Bitcoin futures down about 10%, the market’s bearish sentiment is becoming more pronounced. Sellers are clearly in control, as evidenced by the order flow, while buyers are showing signs of fatigue. The recent rebounds have not gained traction, indicating that the market structure remains weak. If Bitcoin can’t hold above this support zone, we could see further declines, potentially triggering stop-loss orders and cascading sell-offs. Traders should keep an eye on volume and momentum indicators to gauge whether buyers can step in and change the narrative. On the flip side, if Bitcoin manages to reclaim the $72,645 level convincingly, it could signal a shift in sentiment, attracting more buyers and possibly leading to a short squeeze. Watch for any signs of increased buying pressure or volume spikes, especially on the daily charts, as these could indicate a reversal. The next few sessions will be crucial for determining whether this support holds or breaks.
📮 Takeaway
Monitor Bitcoin’s ability to hold the $70,900 to $72,645 support zone; a break below could trigger further downside, while a reclaim could attract buyers.