Bitcoin
  Ethereum
  Tether
  BNB
BNB  XRP
XRP  USDC
USDC  Solana
  TRON
TRON  Figure Heloc
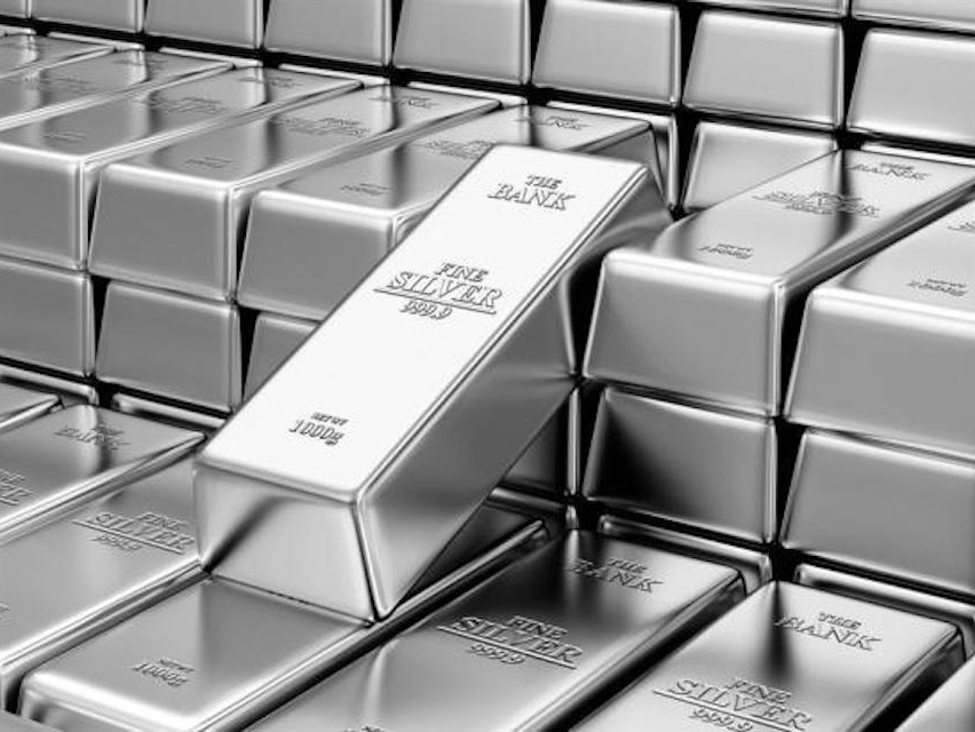
FUNDAMENTAL
OVERVIEWSilver followed gold lower yesterday and dropped into new lows as Treasury yields extended their
gains, with the 30-year reaching the highest level since 2007.Inflation worries and Fed rate hike risks intensified recently as markets
started to grow impatient amid the prolonged US-Iran stalemate and Strait of
Hormuz closure. Traders are now pricing in a 50% chance of a rate hike by
year-end. On the US-Iran front nothing has changed. Trump continues to threaten Iran
with new strikes if they don’t make a deal, while Tehran warns the US that they
have gained military knowledge from previous hostilities and that “a return to
war would feature many more surprises”.The main problem for silver and gold remains the Fed. Although the central
bank is still keeping an easing bias, we are now approaching a point where the
Fed is likely to drop it entirely. If nothing changes before the June meeting,
we might be in for a hawkish surprise as inflation continues to run hot and the
US data remains resilient. In the short-term, a resolution and the reopening of the Strait will likely
support silver on falling oil prices and increased rate cut bets. But if the
Strait remains closed for longer and oil prices stay elevated, the risk of the
Fed being forced to hike anyway increases and that will keep weighing on precious
metals.SILVER TECHNICAL
ANALYSIS – DAILY TIMEFRAMEOn the daily chart, we can
see that silver is approaching the major trendline around the 70.00 handle. If
the price gets there, we can expect the buyers to step in with a defined risk
below it to position for a rally into the 96.00 level. The sellers, on the
other hand, will look for a break to increase the bearish bets into the next
major trendline around the 55.00 handle.SILVER TECHNICAL ANALYSIS –
4 HOUR TIMEFRAMEOn the 4 hour chart, we have
a minor resistance zone around the 79.00 level. If we get a bigger pullback
into that resistance, we can expect the sellers to step in there with a defined
risk above the resistance to keep pushing into the major trendline. The buyers,
on the other hand, will look for a break higher to extend the pullback into the
83.00 resistance next.SILVER TECHNICAL ANALYSIS –
1 HOUR TIMEFRAMEOn the 1 hour chart, there’s
not much we can add here as from a risk management perspective, the sellers
will have a better risk to reward setup around the resistance, while the buyers
will have it around the 70.00 handle. The red lines define the average daily range for today. UPCOMING CATALYSTSToday, we have the FOMC
meeting minutes. Tomorrow, we get the latest US Jobless Claims figures and the
US Flash PMIs.
This article was written by Giuseppe Dellamotta at investinglive.com.
💡 DMK Insight
Silver’s recent drop into new lows signals a critical moment for traders: With the 30-year Treasury yield hitting levels not seen since 2007, the pressure on precious metals is palpable. Higher yields typically strengthen the dollar, making non-yielding assets like silver less attractive. This dynamic is exacerbated by rising inflation concerns and the Fed’s potential rate hikes, which could further dampen demand for silver as a safe haven. Traders should be wary of the correlation between silver and gold, as both are reacting similarly to macroeconomic pressures. Looking ahead, the key level to watch for silver is its recent low; a break below that could trigger further selling pressure. Conversely, if silver manages to hold above this level, it might attract bargain hunters. Keep an eye on the broader market sentiment, especially as geopolitical tensions in the Strait of Hormuz could create volatility that might influence precious metal prices. Watch for any shifts in Treasury yields and Fed commentary, as these will likely dictate silver’s next moves.
📮 Takeaway
Monitor silver’s recent lows closely; a break below could lead to increased selling, while holding above may attract buyers amid rising Treasury yields.