Bitcoin
  Ethereum
  Tether
  BNB
BNB  XRP
XRP  USDC
USDC  Solana
  TRON
TRON  Figure Heloc
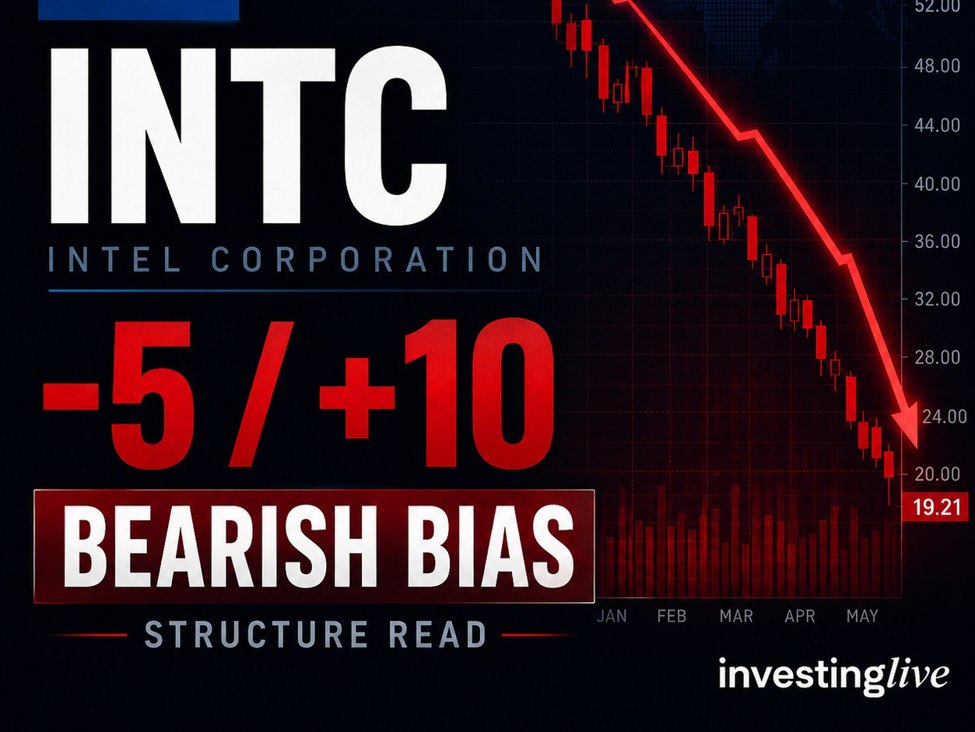
Intel stock analysis today: INTC fails to hold the market gap-up as sellers press toward key supportIntel stock is flashing a more bearish short-term structure after failing to hold yesterday’s market-wide gap-up. INTC was up more than 4% at one stage in pre-market trading, but that strength faded quickly. The latest Structure Read score is -5 on a -10 to +10 scale, pointing to bearish control unless buyers can reclaim 117.00 and repair back toward 118.50.Key takeaways for Intel investors and tradersIntel’s early rally attempt failed, despite the broader market gapping higher.
Prediction Score: -5, which means a bearish read, not an extreme bearish call.
The key fair-value reference is 117.00 POC.
116.05 VAL is now the main downside gate.
A break and hold below 116.05 would likely confirm a deeper bearish phase.
A recovery back above 117.00 would reduce the immediate bearish pressure, but a real bullish repair still needs acceptance above 118.50.
Intel stock: a failed gap-up matters after such a massive rallyIntel has recently been one of the market’s most dramatic momentum names. The stock had already delivered an extraordinary multi-timeframe run, including a surge of roughly 110% in one month and more than 500% over one year, as discussed in our earlier Intel analysis: Intel stock analysis today: After a 510% surge, is INTC starting to show topping risk?That background matters. When a stock has already moved that far, the market becomes more sensitive to failed upside attempts. Yesterday was a good example. The broader market opened with a strong gap-up tone, and Intel initially joined the move, gaining more than 4% in pre-market trading. But the rally did not hold.From the hourly structure, the message was straightforward: early strength turned into rejection. Intel tried to repair higher, but the advance faded, and price later accepted back toward the lower part of the value area. That does not prove the final top is already in, but it does show that the character of the move has changed.In other words, this is no longer a clean momentum chase.What is the Intel prediction score today?Prediction Score: -5 / +10
Confidence: Medium
Market state: Bearish control after failed repair, with possible short-term support risk near VALOn our -10 to +10 scale, -10 is extremely bearish, 0 is neutral, and +10 is extremely bullish. A score of -5 means Intel has shifted into a moderately bearish structure. It is not yet an extreme downside signal because price is still testing the lower value boundary rather than fully accepting below it.The important point is that this is not only about price being down. The issue is the quality of the failed rebound. Intel showed strong buying attempts near the upper side of the visible structure, but those attempts did not create durable acceptance above the 118.50-118.80 area.That is the warning.The 4h INTC stock chart above highlights a potential shift in momentum for Intel (INTC) on a short-term timeframe. Below is an educational breakdown of the key technical indicators shown.I am Looking at This Chart for a Technical Analysis Breakdown of Intel StockTBH, I can apply various advanced analytical frameworks from deep order flow analysis to volume profile dynamics, but I like to look at simple charts as some orientation and a part of the puzzle. Like this here:My simple, yet effective, INTC chart on th 4hr timeframe4-Hour Timeframe: Each candlestick on this chart represents 4 hours of trading activity. This “intermediate” timeframe is often used to identify trends that may last for several days to a few weeksEMA20 (The Grey Line): The 20-period Exponential Moving Average (EMA) is a sensitive indicator that tracks recent price action. When a stock price stays above this line, it signals strong upward momentum; however, “crossing down” below it suggests that immediate momentum is weakeningBearish Crossover: The price action in my above simple 4hr chart shows INTC closing below the EMA20. In technical analysis, a move below this line often acts as a “sell” or “caution” signal, indicating that a period of consolidation or a pullback is likelyPrice Targets & SupportSupport Zone ($104–$106): The highlighted yellow box in the above INTC price chart represents a historical support level. This is a price range where buyers have previously stepped in, and the stock is expected to find interest again if the current decline continuesCurrent Status: As of mid-May 2026, INTC has faced resistance after a parabolic run toward its all-time highs. The current “crossing down” suggests the stock may be cooling off as it heads toward that $104–$106 target zone for a potential “healthy pullback”. A side note: If it gets there, it might also be lead to a temporary bounce before later stops just under the $100 round number get liquadated.Educational Tip: While a cross below the EMA20 is a bearish short-term signal, traders often look for confirmation from other indicators (like RSI or volume) before making a final decision, as moving averages can occasionally produce “false signals” in volatile marketsWhy the failed repair of INTC stock near 118.50-118.80 is importantThe early sequence showed aggressive buying activity, which at first looked constructive. Several buying bursts appeared near the upper part of the structure. But price repeatedly failed to build acceptance above the 118.50-118.80 shelf.That is where the read turns more bearish.Strong buying is not enough by itself. For a bullish recovery, the stock must convert buying activity into higher accepted value. Intel did not do that. Instead, price later rolled over and closed materially lower, suggesting that supply was waiting into strength.A key bearish transition came after buyers had a chance to stabilize above the 117.00 POC. Instead, the market printed a heavy rejection bar and closed near 116.82, with the most active trading zone still much higher around 118.48. In plain English, a lot of business was done higher, but price finished near the lower end of the move.That is a classic failed-repair clue.What is POC and why does 117.00 matter for INTC?POC, or point of control, is the price area where the most trading activity occurred during the measured period. Traders watch it because it often represents the market’s short-term fair-value reference.For Intel today, the key POC is 117.00.As long as Intel remains below or struggles around 117.00, sellers maintain the advantage. A move back above 117.00 would not automatically turn the chart bullish, but it would reduce immediate downside pressure and suggest buyers are trying to repair the lower value area.For now, the late structure is still bearish because price has failed below the POC and is pressing toward 116.05 VAL.Intel stock key levels todayWhy Intel stock traders should care about $116.05 as the next decisive testThe latest close near 116.28 puts Intel just above 116.05 VAL, which is the lower boundary of the current value area.That creates an important tactical setup. Intel is bearish below 117.00, but the next major confirmation point is 116.05. A break below that level would not be just another small dip. It would suggest that the market is accepting price below the lower boundary of value.That would likely justify a more bearish score, potentially toward the -6.5 to -7 zone, especially if any bounce back toward 117.00 fails.What would make Intel more bearish?The bearish case strengthens if Intel:
Breaks below 116.05
Holds below 116.05 for at least one follow-through phase
Fails to reclaim 117.00
Continues to build accepted value below 116.60
Rejects any rebound into 117.50-118.00That would suggest the move is developing from a lower-value test into a more accepted breakdown.What would repair the bearish Intel stock setup?The score would improve toward -2 to neutral if Intel:
Reclaims 117.00
Holds above 117.00 on a retest
Builds accepted value back above the POC
Moves toward 117.50-118.00 without immediate rejection
Later reclaims 118.50-118.80A true bullish reversal still needs more than a bounce. Intel would need to reclaim the 118.50-118.80 failed repair shelf and hold above it. Until then, upside attempts remain suspect.Market background: risk-on headlines, but watch the sell-the-news scenarioThe broader market backdrop is important because Intel’s failure happened during a generally supportive tape. That makes the stock-specific rejection more notable.The latest macro tone includes a mix of risk-on and caution signals. A White House official said Trump and Xi had a good meeting, with trade and economic cooperation discussed. That helped support the broader risk mood, but my view is that traders should also watch for a possible sell-the-news scenario by the end of the week. That is only an opinion-based scenario, not a forecast, but it is worth monitoring after a strong market reaction.Currency and macro markets are also sending mixed signals. The Indian rupee has been pressured by US-Iran and oil-market dynamics, while USD/JPY is testing an important upside breakout area. Meanwhile, today’s main events include US Retail Sales and Jobless Claims, which could influence rate expectations and risk appetite.Liquidity conditions may also be slightly unusual because some parts of Europe are on holiday while markets remain open. In Asia FX, China’s offshore yuan has strengthened to its best level against the dollar since February 2023, which adds another layer to the global risk and dollar story.For Intel, the takeaway is simple: the stock failed to hold strength despite a broadly supportive market backdrop. That increases the importance of the 117.00 and 116.05 levels.Practical Intel trading mapBearish below: 117.00
Breakdown confirmation below: 116.05
Repair zone: 117.00-117.50
Seller test zone: 117.50-118.00
Bullish invalidation of bearish control: sustained acceptance above 118.50For traders, the cleaner short setup is not necessarily chasing Intel at the lows. The better bearish scenarios are either a failed rebound into 117.50-118.00, or a confirmed breakdown below 116.05 with follow-through.For investors, the message is more about risk management. After a huge advance, failed rallies deserve more respect. Intel does not need to collapse for the risk profile to change. Sometimes a topping process begins with failed upside attempts, lower accepted value, and repeated inability to reclaim the prior shelf.Today’s summary for Intel stock investors and tradersIntel’s latest Structure Read is bearish. The stock failed to hold yesterday’s broader market gap-up, could not sustain acceptance near 118.50-118.80, lost the 117.00 POC, and is now pressing toward 116.05 VAL.The next decisive test is 116.05. A break and hold below that level would likely confirm a deeper bearish phase. A reclaim of 117.00 would reduce the immediate pressure, but Intel still needs acceptance above 118.50 to invalidate bearish control.Always do your own research and invest or trade INTC stock at your own risk only. The above is for educational purposes only. There may be future updates on https://t.me/investingLiveStocks
This article was written by Itai Levitan at investinglive.com.
💡 DMK Insight
Intel’s inability to maintain its pre-market gains signals potential weakness ahead. After a promising start with a 4% rise, the stock’s quick reversal indicates that sellers are stepping in, testing key support levels. This shift could trigger a bearish sentiment among traders, especially if INTC breaks below its recent support. For day traders, this presents a critical moment to watch for a potential short position if the stock closes below its support level. On the flip side, if buyers manage to reclaim momentum, it could lead to a rebound, but that seems less likely given the current market pressure. Keep an eye on broader tech sector trends, as they often influence Intel’s performance. If the NASDAQ continues to struggle, INTC might follow suit, amplifying any bearish moves. Watch for volume spikes as a signal of increased selling pressure, which could confirm a downward trend in the coming days.
📮 Takeaway
Monitor Intel’s support levels closely; a break below could signal a bearish trend, while a recovery might offer a buying opportunity.