Bitcoin
  Ethereum
  Tether
  XRP
XRP  BNB
BNB  USDC
USDC  Solana
  TRON
TRON  Figure Heloc
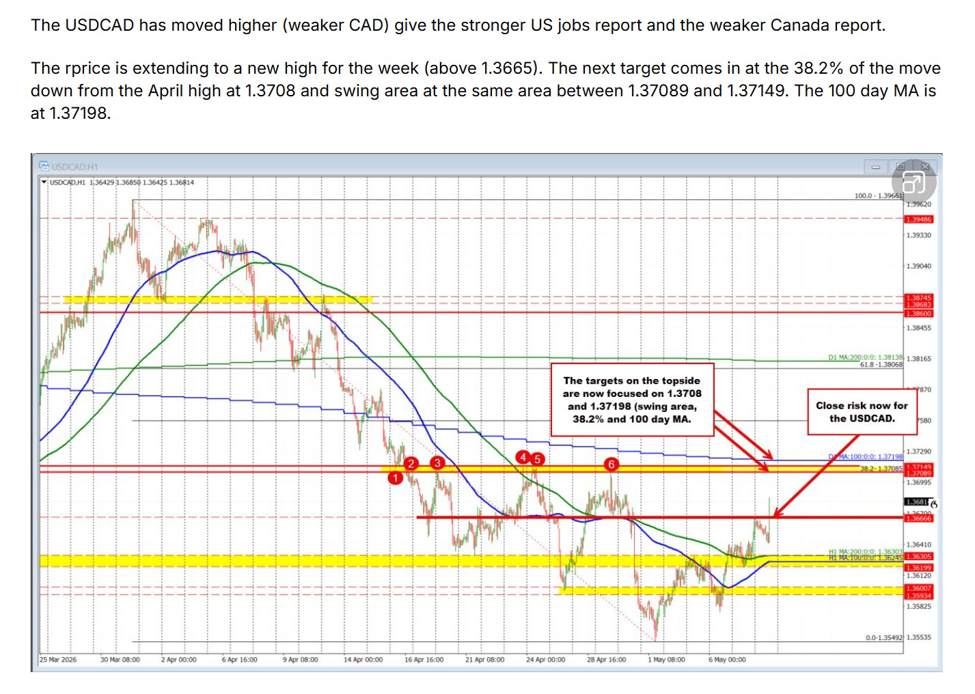
Soon after the better-than-expected US jobs report in the worse than expected Canadian jobs report, I posted the following brief commentary and chart:The key resistance zone overhead was defined by the 38.2% retracement level, the swing area between 1.37089 and 1.37149, and the 100-day moving average near 1.3720. The price pushed higher into that resistance cluster, reaching a session high of 1.3710 before rotating back to the downside. The current price has now returned to the same area where the earlier post was made, reflecting the market’s inability to sustain momentum above the key technical ceiling.On the downside, support now comes in near 1.3660. A move below that level would likely disappoint buyers and could lead to a deeper rotation lower, with traders then targeting the 200-hour and 100-hour moving averages near 1.3631 over time.On a move back to the upside, buyers still need to break above the aforementioned resistance targets to regain more control from the sellers. Since the beginning of April, sellers have largely dictated the price action. Although this week’s move above the 100-hour and 200-hour moving averages was a modest positive development for buyers, the more important hurdles remain the 38.2% retracement level and the 100-day moving average. A sustained move above those levels would be needed to shift the technical bias more firmly back in favor of the buyers.
This article was written by Greg Michalowski at investinglive.com.
💡 DMK Insight
The mixed jobs reports from the US and Canada are shaking up the forex market, and here’s why that matters: With the US jobs data coming in stronger than expected, traders might see the dollar gaining momentum, especially against the loonie, which is struggling after Canada’s disappointing figures. The key resistance zone around 1.3720, marked by the 100-day moving average and the 38.2% retracement level, is critical for traders to watch. If the USD/CAD pair breaks above this level, it could signal a bullish trend, potentially pushing prices higher towards the next resistance levels. Conversely, failure to breach this zone might lead to a pullback, giving traders a chance to reassess positions. It’s worth noting that the market’s reaction could be influenced by upcoming economic indicators, so keeping an eye on the broader economic landscape is essential. Watch for any shifts in sentiment, especially from institutional players, as they often set the tone for the market. The immediate focus should be on the 1.3720 level; a close above it could trigger further buying interest.
📮 Takeaway
Monitor the 1.3720 resistance level closely; a break above could lead to a bullish USD/CAD trend, while failure might prompt a pullback.