Bitcoin
  Ethereum
  Tether
  XRP
XRP  BNB
BNB  USDC
USDC  Solana
  TRON
TRON  Figure Heloc
FUNDAMENTAL
OVERVIEWGold has extended the
losses yesterday after a technical breakout of the recent consolidation. The
main thing that’s been weighing on precious metals has been the hawkish central
banks amid the renewed inflation risk.That looks unlikely to
change anytime soon as Trump has rejected Iran’s proposal to first open the
Strait of Hormuz and then hold nuclear talks. Unfortunately, with US stock
prices at all-time highs Trump might not feel any pressure to concede. This might even set the
stage for the next big selloff if the Strait of Hormuz remains closed for much
longer and oil prices stay elevated, thus forcing the Fed to hike interest
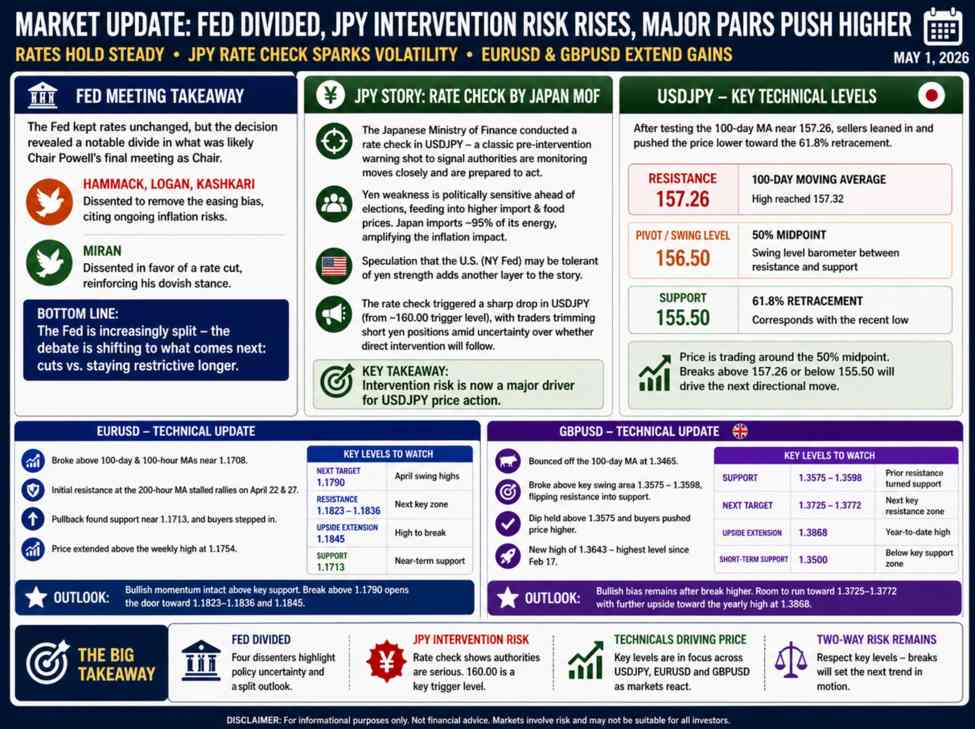
rates in the coming months. Today, we have the FOMC
policy decision and although the Fed is expected to keep everything unchanged
amid the US-Iran uncertainty, there’s a risk of a more hawkish leaning due to
resilient US data and a longer than expected US-Iran war. A neutral Fed
shouldn’t bring much volatility, but a more hawkish one could add more pressure
on gold.GOLD TECHNICAL
ANALYSIS – DAILY TIMEFRAMEOn the daily chart, we can
see that gold extended the losses as the US-Iran stalemate pushed oil prices
back into triple digit levels. We are trading right in the middle of the two
key trendlines, so there’s no clear level where to lean on here. We need to
zoom in to see some more details.GOLD TECHNICAL ANALYSIS – 4
HOUR TIMEFRAMEOn the 4 hour chart, we can
see the price reached the first key swing level at 4,552 and started to
consolidate. We have a minor downward trendline defining the current bearish
momentum. If we get a pullback into the trendline, we can expect the sellers to
lean on it with a defined risk above it to keep pushing into new lows. The
buyers, on the other hand, will look for a break to pile in for a rally into
the 5,000 level next.GOLD TECHNICAL ANALYSIS – 1
HOUR TIMEFRAMEOn the 1 hour chart, there’s
not much we can add here as from a risk management perspective, the sellers
will have a better risk to reward setup around the trendline. Nonetheless, we
can expect the buyers to continue to step in around the 4,552 level to keep
targeting the trendline, while a break lower will likely trigger a selloff into
the 4350 level next. The red lines define the average daily range for today. UPCOMING CATALYSTSToday we have the FOMC policy decision. Tomorrow, we get the US Q1 GDP,
the US Employment Cost Index and the latest US Jobless Claims figures. On
Friday, we conclude the week with the US ISM Manufacturing PMI.
This article was written by Giuseppe Dellamotta at investinglive.com.
💡 DMK Insight
Gold’s recent losses signal a shift in market sentiment, and here’s why that matters: With SOL currently at $85.12, the precious metals market is feeling the pressure from hawkish central bank policies and rising inflation risks. Traders should note that gold’s technical breakout from its consolidation phase suggests a potential for further declines, especially if inflation continues to rise and central banks maintain their aggressive stances. This could lead to a stronger dollar, which typically inversely affects gold prices. For those trading SOL, keep an eye on how gold’s performance might influence broader market sentiment. If gold continues to slide, it could trigger a risk-off environment, impacting cryptocurrencies like SOL. Watch for key support levels in gold; a break below recent lows could accelerate selling pressure. Conversely, if inflation data surprises to the upside, we might see a temporary bounce in gold, which could also affect crypto sentiment positively. Overall, monitor inflation reports and central bank communications closely, as they will likely dictate market direction in the coming weeks.
📮 Takeaway
Watch for gold’s support levels; a break could signal further declines, impacting SOL and broader market sentiment.