Bitcoin
  Ethereum
  Tether
  XRP
XRP  BNB
BNB  USDC
USDC  Solana
  TRON
TRON  Figure Heloc
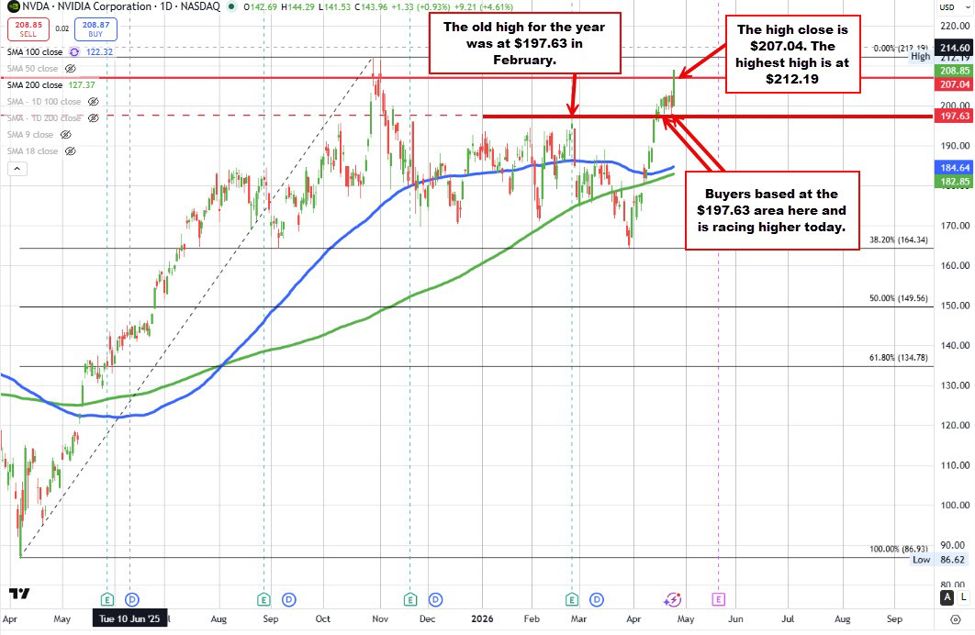
Shares of Nvidia have just spiked up to a high of $208.88. That took the price up by over $9 or 4.5% on the day. The price also moved above its all-time high closing level going back to October 29 at $207.04.Since March 30 with the market closing at its low at $165.17.Total trading days: ~18
Up days: 13Down days: 5What stands outStrong upside run followed, including a ~10-day winning streak into mid-April
Late April saw a couple of pullback days, but the trend remained higher overall
Bottom lineBias: Clearly bullish since March 30
Structure: More than 2-to-1 up vs down daysTheme: Classic “break low → trend higher” behavior—buyers in control most sessionsTechnically, the move higher has checked a lot of bullish boxes for NVIDIA (NVDA). On the run-up, the price pushed back above its 200-day moving average at $182.85 and the 100-day moving average at $184.63 (green and blue lines on the daily chart above), flipping the bias back to the upside, after the corrective move lower that corrected the price to the 38.2% of the move up from 2025 low . Holding that retracement, proved to be a solid support. From there, the market extended above the 100/200 day MAs and broke above the “old” 2026 high from February 25 at $197.63, which was a key ceiling.What’s more important is what happened after the break. The subsequent corrective lows came in at $197.84 on April 20 and $197.22 on April 23—basically holding right around that old high. That’s what you want to see. Former resistance turning into support is a classic sign that buyers are still in control. The ability to hold that area and push higher over the last few sessions keeps the bullish bias intact.From a trading perspective, that $197.63 level is your risk barometer. Stay above, and buyers remain in control. Move below, and the door opens for a deeper correction on the disappointment.On the topside, the next target is clear: the all-time high from October 29 at $212.19. With the current price trading around $208.65, the market is within striking distance. The question now is whether momentum can carry it through that level and into new high ground.Shares of chips stocks are taking their clue from Intel with the share price currently up $16 or 24.06%. For the trading year, Intel shares are up 124.53%. Shares of micron are also surging by 4.47%. There shares are up 76.26% in 2026. Intel shares in comparison are only up 12.17% for the trading year.Below is a list of chip sector stocks and the winners and losers today:Chip Sector – Daily % Change (Updated)How are the Magnificent 7 doing today?The price action is leaning mostly to the upside, led by a standout move in NVIDIA, which is up close to 5% Amazon and Meta also posted solid gains, while Microsoft and Tesla chipped in with more modest advances. On the flip side, Alphabet and Apple lagged, both closing lower and acting as a drag on the group.Year-to-date, the performance across the Magnificent 7 is a bit more mixed. On the topside, Amazon and NVIDIA are leading the way with gains of around 12%, showing where the strength and momentum has been concentrated. Alphabet is also holding solid gains, while Meta is barely positive—more of a laggard among the winners.On the downside, Apple is essentially flat on the year, but Microsoft and Tesla stand out as the clear underperformers, both down double digits. Tesla, in particular, is lagging the most, down over 16%.So when you step back, the theme is pretty clear: leadership is narrow, with a few names carrying the weight, while others—especially Microsoft and Tesla—have struggled. It’s not a broad-based rally across the group, but rather a selective, momentum-driven move led by a handful of names.
This article was written by Greg Michalowski at investinglive.com.
💡 DMK Insight
Nvidia’s surge to $208.88 is a significant moment for traders: here’s why. Breaking above its previous all-time high of $207.04 not only signals bullish momentum but also opens up potential for further gains. This spike could attract momentum traders looking to capitalize on the upward trend, especially with the stock gaining over $9 or 4.5% in a single day. Keep an eye on the daily chart; if Nvidia can maintain this level, it may set a new support zone, which could be critical for future trades. However, it’s worth noting that such rapid gains often lead to profit-taking, so watch for any signs of reversal or increased volatility. On the flip side, if Nvidia retraces below $207, it could trigger stop-loss orders and create a cascading effect, leading to a deeper pullback. Traders should monitor volume closely; a spike in volume accompanying the price rise could confirm the strength of this move. The next key level to watch is $210, which could act as a psychological barrier. Overall, this breakout could have ripple effects on related tech stocks, particularly in the semiconductor sector, so keep those on your radar as well.
📮 Takeaway
Watch for Nvidia to hold above $207; a drop below could trigger selling pressure, while a push past $210 may attract more buyers.