Bitcoin
  Ethereum
  Tether
  XRP
XRP  BNB
BNB  USDC
USDC  Solana
  TRON
TRON  Figure Heloc
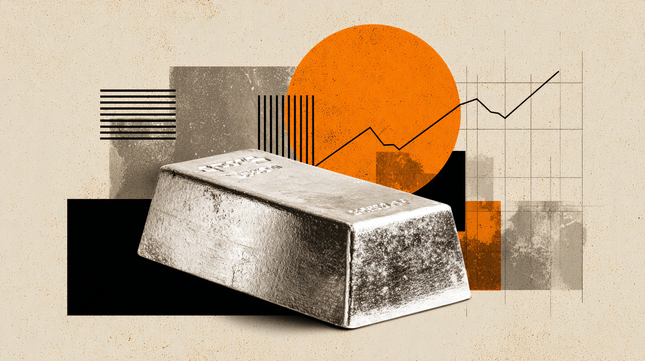
Silver (XAG/USD) price halted its advance on Wednesday as a doji candle emerged near the 50-day Simple Moving Average (SMA) at $79.09, a sign of indecision among traders, whether to push prices towards the next cycle high at $90.01 —the March 10 high—, or challenge the 100-day SMA key support at $76
💡 DMK Insight
Silver’s recent price action is a classic case of indecision, and here’s why that matters for traders: The doji candle formation near the 50-day SMA at $79.09 indicates a critical juncture. Traders are weighing whether to break above resistance at $90.01 or test the 100-day SMA support. This indecision could lead to increased volatility, especially if we see a decisive move in either direction. For day traders, this means monitoring the $79.09 level closely; a break above could signal a bullish trend, while a drop below might trigger a bearish sentiment. Additionally, keep an eye on correlated assets like gold (XAU/USD), which often move in tandem with silver and could provide clues about market sentiment. But don’t overlook the potential for a false breakout. If silver pushes past $90.01 without strong volume, it might just be a trap. The real story is how traders react to these key levels. Watch for volume spikes and momentum indicators to gauge the strength of any breakout or breakdown. With the market at such a pivotal point, having a clear strategy for both scenarios will be crucial.
📮 Takeaway
Watch for a decisive move above $79.09 or below the 100-day SMA to gauge silver’s next direction; volatility is likely ahead.