Bitcoin
  Ethereum
  Tether
  BNB
BNB  XRP
XRP  USDC
USDC  Solana
  Figure Heloc
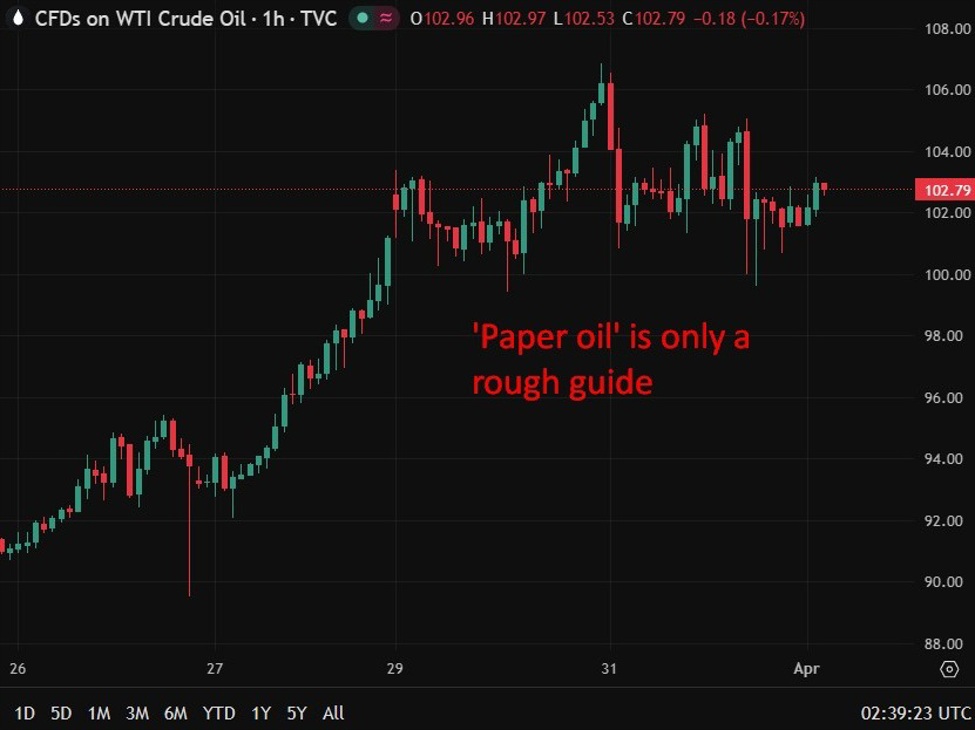
Market signals from insurance, shipping flows and physical oil pricing point to ongoing disruption in Hormuz, despite conflicting narratives. Mid-April looms as a key turning point as temporary supply supports begin to expire.Summary:Headline noise rising, but real signals sit in physical markets
Hormuz insurance costs surge to 3.5–10% vs ~0.25% pre-war
Shipping volumes collapse ~90%, showing real disruption
Physical oil trades at premium to futures, exposing pricing disconnect
Mid-April seen as critical inflection point for global supply
With conflicting headlines dominating the narrative around the Iran conflict, investors are increasingly looking beyond official statements and analyst forecasts to gauge what is actually happening in energy markets.Recent commentary from policymakers and analysts has ranged widely, from expectations of a rapid end to the war to warnings of prolonged disruption and extreme oil price outcomes. This divergence has made it difficult to form a coherent market view based purely on rhetoric. Instead, attention is shifting toward real-time indicators tied to physical flows and financial risk.One of the clearest signals comes from maritime insurance markets. Premiums for tankers transiting the Strait of Hormuz have surged from around 0.25% of vessel value before the conflict to between 3.5% and 10%. In many cases, coverage is either prohibitively expensive or unavailable. This sharp repricing reflects the assessment of underwriters with significant capital at risk, offering a more grounded measure of perceived danger than official commentary.Shipping activity provides another critical gauge. Vessel tracking data shows a dramatic drop in traffic through the strait, with daily transits falling from over 100 ships to single-digit levels. While some cargoes, particularly linked to key buyers such as China and India, continue to move, overall flows remain severely constrained. A sustained recovery in volumes would be one of the earliest signs of stabilisation.Pricing dynamics in oil markets also point to underlying stress. While benchmark Brent crude remains elevated, physical grades such as Dubai crude are trading at a meaningful premium, indicating that end-users are paying more than headline prices suggest. This divergence reflects tight supply conditions and highlights the limitations of relying solely on futures markets to assess real-world costs.Looking ahead, mid-April is shaping as a key inflection point. Several temporary measures currently cushioning the supply shock—including strategic reserve releases and policy waivers—are set to expire. Without these supports, the existing supply deficit could widen significantly, increasing the risk of further volatility.Taken together, these indicators suggest that while narratives remain fluid, underlying market conditions continue to reflect significant disruption, with the trajectory increasingly dependent on whether physical flows through Hormuz can normalise in the coming weeks. From pre war
This article was written by Eamonn Sheridan at investinglive.com.
💡 DMK Insight
Oil markets are on edge as Hormuz disruptions escalate, and here’s why that matters: Insurance costs for shipping have skyrocketed to 3.5–10%, a stark contrast to the previous ~0.25%. This surge indicates heightened risk perceptions among traders, which could lead to increased volatility in oil prices. With mid-April approaching, temporary supply supports are set to expire, potentially exacerbating the situation. Traders should keep an eye on physical oil pricing and shipping flows, as these metrics will provide clearer insights into supply chain stability. If disruptions continue, we could see a significant spike in oil prices, impacting not just crude but also related assets like energy stocks and ETFs. On the flip side, some might argue that the market is overreacting to headline noise. However, given the current geopolitical climate, dismissing these signals could be risky. Watch for any shifts in insurance costs or shipping routes, as these could serve as leading indicators for price movements. Key levels to monitor include the recent highs in oil prices, which could act as resistance if the market reacts negatively to ongoing disruptions.
📮 Takeaway
Monitor insurance costs and shipping flows closely; a sustained rise could signal significant oil price volatility ahead, especially as mid-April approaches.