
 Bitcoin
  Ethereum
  Tether
  BNB
BNB  XRP
XRP  USDC
USDC  Solana
  TRON
TRON  Lido Staked Ether
  Figure Heloc
South Korea Industrial Output (YoY) down to 1.5% in April from previous 3.6% 🔗 Source 💡 DMK Insight South Korea’s industrial output dropping to 1.5% YoY is a red flag for traders: This decline from 3.6% signals potential economic slowdown, impacting sectors reliant on manufacturing and exports. For forex traders, this could weaken the South Korean won against major currencies, especially if the trend continues. Look for correlated assets like Korean ETFs or companies heavily tied to exports, as they might face headwinds. Moreover, this data could influence Bank of Korea’s monetary policy, potentially leading to rate cuts if the economy doesn’t pick up. Keep an eye on the 1,200 level for USD/KRW; a breach could trigger further selling pressure on the won. Watch for any upcoming economic indicators that might confirm or refute this trend, as they could provide actionable insights for positioning in both forex and equities. 📮 Takeaway Monitor the USD/KRW pair closely; a break above 1,200 could signal further weakness in the won amid slowing industrial output.

South Korea Industrial Output Growth dipped from previous 0.3% to -0.7% in April
South Korea Industrial Output Growth dipped from previous 0.3% to -0.7% in April 🔗 Source 💡 DMK Insight South Korea’s industrial output growth turning negative is a red flag for traders: A drop from 0.3% to -0.7% signals potential economic slowdown, impacting not just local markets but also global supply chains. This decline could lead to decreased demand for commodities and affect related sectors, especially in technology and manufacturing. Traders should monitor how this affects the South Korean won and related ETFs, as a weaker industrial output often correlates with currency depreciation. Look for key support levels in the won against the dollar; if it breaks below recent lows, it could trigger further selling pressure. Additionally, keep an eye on how this news influences broader Asian markets, as investor sentiment may shift towards safe-haven assets. The real story here is whether this trend continues, so watch for upcoming economic indicators that could confirm or refute this downturn. 📮 Takeaway Watch for the South Korean won’s reaction; a break below recent support levels could signal further weakness in the currency.

Gold rebounds to near $4,500 after US and Iran reach outline ceasefire deal
Gold price (XAU/USD) edges higher to near $4,500 during the early Asian session on Friday. The precious metal rebounds from a two-month low hit in the previous session after reports that the United States (US) and Iran had reached a ceasefire extension agreement. 🔗 Source 💡 DMK Insight Gold’s rise to near $4,500 signals a shift in market sentiment amid geopolitical tensions. The recent ceasefire agreement between the US and Iran has eased immediate fears, allowing gold to recover from its two-month low. This rebound is crucial for traders, as it suggests a potential reversal in the bearish trend that has dominated the market. If gold can hold above this level, it could attract more buying interest, especially from institutional players looking for safe-haven assets. Watch for resistance around $4,600; a break above could signal further bullish momentum. Conversely, if geopolitical tensions escalate again, we might see gold retreat, so keeping an eye on news developments is essential. Here’s the flip side: while the ceasefire is a positive development, it doesn’t eliminate the underlying economic uncertainties. Inflation concerns and potential interest rate hikes could still weigh on gold prices. Traders should monitor the upcoming economic data releases closely, particularly any shifts in the Fed’s stance, as these could impact gold’s trajectory significantly. 📮 Takeaway Watch for gold to maintain above $4,500; a break above $4,600 could signal further bullish momentum amid easing geopolitical tensions.

Ethereum under $2K: ETH whales sell as retail remains bullish
ETH’s price has entered a decisive breakdown stage of its prevailing technical pattern, indicating further declines toward $1,750 despite strong retail sentiment. 🔗 Source 💡 DMK Insight ETH’s recent breakdown below key support levels is a red flag for traders. Currently priced at $2,011.66, ETH is flirting with a critical technical threshold. A sustained move below this level could trigger a cascade of selling, pushing it toward the $1,750 mark. This isn’t just about price; it reflects broader market sentiment where retail enthusiasm isn’t enough to counteract bearish technical signals. Traders should be wary of the potential for increased volatility as positions are unwound. If ETH fails to reclaim the $2,100 level, it could signal a shift in momentum, leading to further declines. Watch for volume spikes around these levels, as they could indicate whether the market is ready to support or reject this breakdown. On the flip side, if ETH manages to bounce back and hold above $2,100, it could attract buyers looking for a dip, but that seems less likely given the current trend. Keep an eye on related assets like BTC, as its movements often influence altcoin behavior. The next few days will be crucial for determining ETH’s trajectory. 📮 Takeaway Watch for ETH to hold above $2,100; a drop below $1,750 could trigger significant selling pressure.
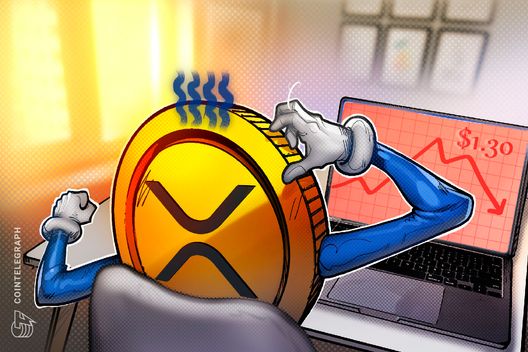
XRP drops to 16-week lows: Can price fall below $1?
XRP breaks key support at $1.30 as bearish technical setups and weak investor sentiment point to a deeper correction toward $0.63. 🔗 Source 💡 DMK Insight XRP’s drop below $1.30 is a red flag for traders: it signals potential for a deeper correction. The breach of this key support level aligns with bearish technical indicators, suggesting that sellers are gaining control. If XRP continues to slide, the next significant support could be around $0.63, which traders should monitor closely. Weak investor sentiment is also a concern; it often leads to increased volatility and can trigger further sell-offs. Look for volume spikes or changes in sentiment to gauge if this trend is reversing or gaining momentum. On the flip side, if XRP manages to reclaim the $1.30 level, it could indicate a short-term bounce, but that would require strong buying pressure and a shift in market sentiment. Keep an eye on broader market trends, especially in related assets like Bitcoin and Ethereum, as they can influence XRP’s price action significantly. Watch for any news or developments that might impact investor confidence in the coming days. 📮 Takeaway Traders should watch for XRP’s ability to hold below $1.30; a drop toward $0.63 could be imminent if bearish sentiment persists.
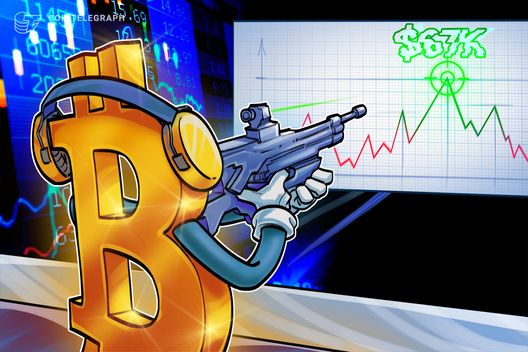
Bitcoin bids farewell to CME futures gaps with $67K still on the radar
Bitcoin approached the final week of CME futures gaps with several still open, providing potential BTC price targets as low as $67,000. 🔗 Source
Bitcoin enters cooldown phase under $75K as ‘active distribution’ rises
Bitcoin’s slide toward $73,000 triggered active distribution signals, but lowered realized losses and weak spot volumes point to easing sell pressure. 🔗 Source 💡 DMK Insight Bitcoin’s dip near $73,000 is sparking distribution signals, but here’s the twist: lower realized losses and weak spot volumes suggest sell pressure might be easing. Traders need to pay attention to the distribution signals, as they could indicate a shift in market sentiment. However, the fact that realized losses are decreasing means that many holders aren’t panicking, which could stabilize prices. Weak spot volumes also imply that there’s not a rush to sell, hinting at potential accumulation zones forming. If Bitcoin can hold above $70,000, it might attract more buyers looking for a bargain, especially if we see a bounce back in trading volume. On the flip side, if Bitcoin breaks below $70,000, it could trigger further selling as stop-loss orders get hit. Keep an eye on the $73,000 level as a potential resistance point; a sustained move above this could signal a bullish reversal. Watch for volume spikes that could indicate renewed interest from retail or institutional investors, which could provide the momentum needed to push prices higher. 📮 Takeaway Monitor Bitcoin’s price action around $73,000; a break above could signal a bullish reversal, while a drop below $70,000 may trigger further selling.

Solana open interest drops 30% as altcoins slump: Is $68 SOL next?
Bulls abandon ship as SOL futures open interest dropped 30% in May. With the price weakening near $80, Solana may be destined for new lows. 🔗 Source 💡 DMK Insight SOL’s futures open interest plummeting 30% is a red flag for bulls: This sharp decline signals a loss of confidence among traders, especially as SOL hovers around the critical $80 mark. A sustained break below this level could trigger further selling pressure, potentially pushing the price toward new lows. Given the current sentiment, day traders should be wary of entering long positions until we see a reversal or stabilization above $80. Look for volume spikes or bullish divergence on the daily chart as indicators of a potential turnaround. On the flip side, if SOL continues to weaken, it could drag down related assets like other altcoins that typically follow Solana’s lead. Keeping an eye on broader market trends, including Bitcoin’s performance, will be crucial in gauging the overall sentiment in the crypto space. 📮 Takeaway Watch for SOL to hold above $80; a break below could lead to new lows and increased selling pressure.

Morning Minute: Crypto Majors Slide on Iran Escalations, ETF Outflows
Massive ETF outflows just sent crypto sharply lower. Jefferies says the next crypto IPO wave could create a $1T public market. 🔗 Source 💡 DMK Insight Massive ETF outflows are shaking up the crypto market, and here’s why you should care: When large investors pull out, it often signals a lack of confidence, which can lead to further declines. This recent downturn could be a reaction to broader economic concerns or profit-taking after recent rallies. Jefferies’ prediction of a $1T public market from upcoming crypto IPOs is intriguing, but it’s crucial to remember that these projections can be overly optimistic, especially in a volatile environment. Traders should keep an eye on key support levels to gauge whether this dip is a buying opportunity or a sign of deeper issues. Watch for how Bitcoin and Ethereum react in the coming days. If Bitcoin holds above a critical support level, it might attract buyers looking for a bargain. Conversely, if it breaks down, expect a wave of selling pressure. The interplay between ETF flows and IPO expectations will be pivotal—monitoring these dynamics could reveal hidden opportunities or risks. 📮 Takeaway Keep an eye on Bitcoin’s support levels; a break could trigger more selling, while holding could attract buyers amid ETF outflows.

Prediction Market Myriad Launches $100K World Cup Competition
A prize pool of over $100,000 is available for top traders and makers on prediction markets linked to FIFA World Cup matches. 🔗 Source 💡 DMK Insight The $100,000 prize pool for prediction markets tied to FIFA World Cup matches is a game-changer for traders looking to capitalize on sports volatility. With the World Cup generating massive global interest, this prize pool could attract a wave of new participants, increasing liquidity and potentially driving up market volatility. Traders should keep an eye on how these prediction markets respond to match outcomes, as they can provide insights into broader market sentiment and trends. The excitement around the World Cup could also spill over into related assets, like sports betting stocks or crypto platforms that support these markets. However, it’s worth noting that while the prize pool is enticing, it could also lead to speculative bubbles as traders chase quick profits. Monitoring key match dates and outcomes will be crucial, as these events could create sharp price movements in prediction markets. Watch for any shifts in trading volume or sentiment as the tournament progresses, especially around high-stakes matches. 📮 Takeaway Keep an eye on prediction markets linked to the World Cup; volatility could spike, presenting trading opportunities around key match outcomes.