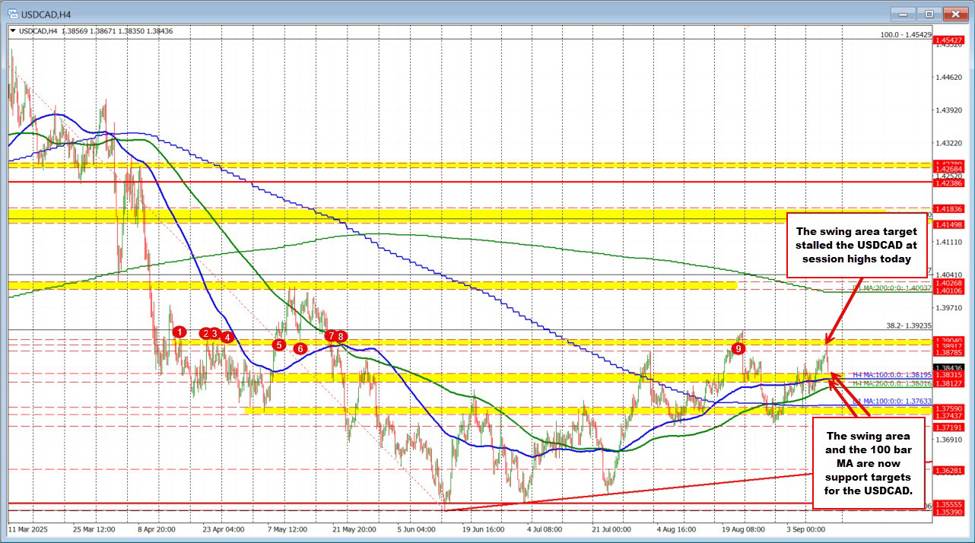
The USDCAD moved higher earlier in the session, pressing into the 1.3891–1.3904 zone, which marked the low of a key swing area highlighted in yesterday’s technical update. That level once again proved to be a tough ceiling. The inability to extend through resistance, coupled with U.S. data releases—initial jobless claims and CPI—shifted the tone, sparking a steady move lower in the pair over the past few hours.On the downside, the decline has carried the pair back toward another swing area between 1.3812 and 1.3831. This zone is now joined by the rising 100-hour moving average, currently at 1.3859, making it a critical short-term pivot for traders.This area will serve as the barometer for near-term bias. For dip buyers, the 1.3812–1.3831 region offers a potential support zone to lean against. A bounce from here could see momentum shift back to the upside, with the 1.3890–1.3904 zone again coming into play as resistance.Conversely, a decisive break below the 100-hour MA and the swing floor at 1.3812 would tilt the balance toward sellers, increasing the bearish bias and opening the door for a deeper correction. This article was written by Greg Michalowski at investinglive.com. Source: investinglive.com (Read Full Article)
If you could go back a year ago, this was the clear Trump-election trade – a 12x winner
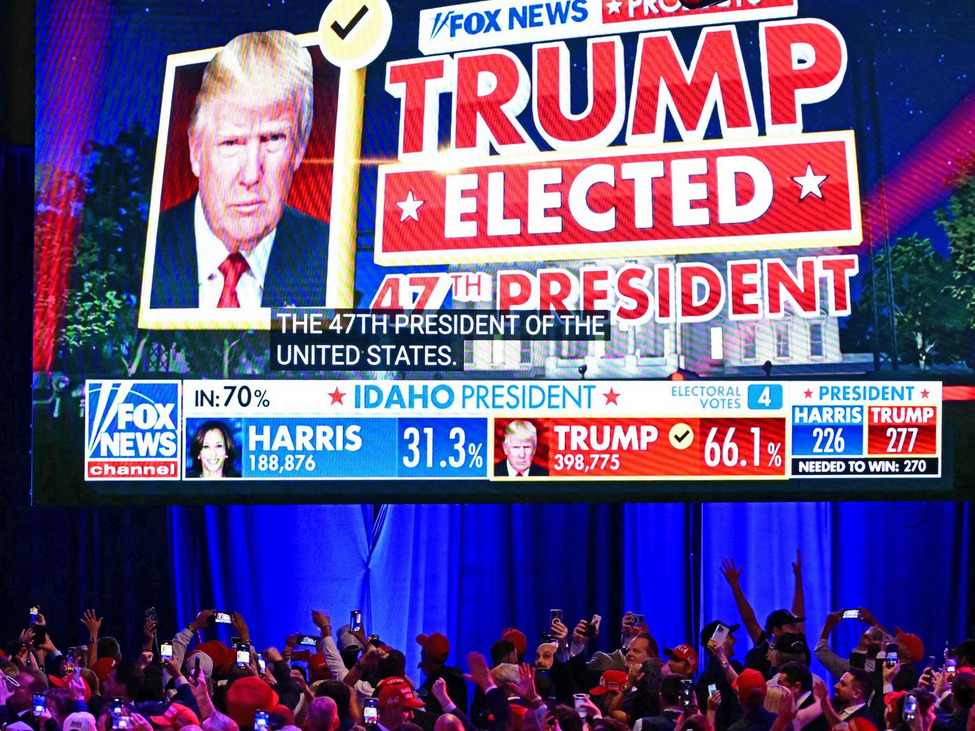
At this time last year, plenty of people believed Kamala Harris was a flawed candidate and Trump was poised to win the election, despite betting odds being close. Moreover, Trump carried a Republican sweep, which appeared to be a longshot at the time, particularly in the House.Many of the ‘Trump trades’ didn’t work. For instance, Jim Cramer touted New Fortress Energy as an LNG approval play and it made wide swings initially as Trump’s odds of winning improved. The company itself proved to have too much debt and is down 86%.At the time I highlighted a series of seven ideas from Cramer that were Trump trades:Short Nike (NKE): −2.81% (was down significantly though after Liberation Day)Short Starbucks (SBUX): −8.94% Albertsons (ACI): +5.65% (this was a merger trade, still not approved)Amazon (AMZN): +28.3% (this was more beta rather than anti-trust thesis) Apple (AAPL): +3.52% (underperformed Nasdaq badly) Johnson & Johnson (JNJ): +8.42% New Fortress Energy (NFE): −86.13%All told those are decent but the S&P 500 gained 15.9% over that time so I’m not sure there’s any alpha here.The correct answer to the Trump trade was deciphered by Bill Ackman, who highlighted the GSEs (Fannie Mae and Freddie Mac) in December (albeit after the election) as a Trump winner.I am often asked for stock recommendations, but generally don’t share individual names unless I believe the risk versus the reward is extraordinarily compelling. As we look toward 2025, one investment in our portfolio stands out for large asymmetric upside versus downside so I thought I would share it. We have owned Fannie Mae and Freddie Mac common stock for more than a decade. Today, they trade at or around our average cost. As such, they have not been great investments to date. What makes them particularly interesting today versus any other time in history is that there is a credible path for their removal from conservatorship in the relative short term, that is, in the next two years. During Trump’s first term, Secretary Mnuchin took steps toward this outcome, but he ran out of time. I expect that in the second Trump administration, Trump and his team will get the job done. Fannie Mae was trading at $2.65 when he wrote that and it was in thin-late December liquidity. It kicked off a bit of a meme frenzy as it doubled in the following week. However even if you were late to that initial move, there have been 3x gains. if you were smart enough to figure out this trade way back in September 2025 — and there were certainly people talking about it — it was trading at $1.20.With shares now at $14.40, that’s a 12x return.For the Ackman trade, it doesn’t show any particular cunning as he owned it for 10 years before the Trump decision, but it does highlight that sometimes you have to be extraordinarily patient for a trade to work — and work big.Today, US Commerce Secretary Howard Lutnick is saying the Fannie and Freddie could go public sooner than people think and that it could be the largest IPO in history. This article was written by Adam Button at investinglive.com. Source: investinglive.com (Read Full Article)
Hong Kong Police Arrest Two Over Alleged Crypto Mining in Care Homes
Authorities say the men tapped into the electricity supply of facilities for the disabled in order to illicitly mine cryptocurrency. Source: decrypt.co (Read Full Article)
Three Main Catalysts Driving Ethereum's Price: Sygnum
Strong fundamental developments, supply shock and institutional demand are driving Ethereum’s valuation higher, the digital asset bank said. Source: decrypt.co (Read Full Article)
Senator John Kennedy Says GOP Not Ready To Advance Crypto Bill
Kennedy called the crypto market bill “a full leap,” clashing with Tim Scott’s end-September push as Democrats and banks call for more time. Source: decrypt.co (Read Full Article)
Morning Minute: Solana's New Path to ATH
This crypto cycle is all about flows, and now SOL has them in spades. Plus crypto majors rally after a soft PPI print as the CPI looms. Source: decrypt.co (Read Full Article)
Bitcoin Price Breaches $114K as ETF Inflows Hit 8-Week High
Experts attributed Bitcoin’s rise and massive ETF influx to investor speculation ahead of key macroeconomic events. Source: decrypt.co (Read Full Article)
What is the distribution of forecasts for the US CPI?
The ranges of estimates are important in terms of market reaction because when the actual data deviates from the expectations, it creates a surprise effect. Another important input in market’s reaction is the distribution of forecasts. In fact, although we can have a range of estimates, most forecasts might be clustered on the upper bound of the range, so even if the data comes out inside the range of estimates but on the lower bound of the range, it can still create a surprise effect.CPI Y/Y 3.1% (2%)3.0% (12%) 2.9% (73%) – consensus2.8% (10%) 2.7% (3%) CPI M/M0.5% (3%)0.4% (27%)0.3% (67%) – consensus0.2% (3%)Core CPI Y/Y3.2% (2%)3.1% (86%) – consensus3.0% (12%) Core CPI M/M0.4% (13%) 0.3% (84%) – consensus0.2% (3%)As always, the focus will be on the Core figures. We can notice that we have a strong consensus for 3.1% for the Core Y/Y and the 0.3% for the Core M/M. Therefore, the biggest moves will likely be triggered by deviations from these figures as that would be in the very low consensus.A soft report will likely raise the probabilities for a 50 bps cut to around 40-60% and then WSJ’s Timiraos could “leak” again before Wednesday by how much the Fed is likely to cut.On the other hand, a hot report won’t change anything regarding the 25 bps September cut but could trigger a slightly hawkish repricing for the 2026 pricing (3 rate cuts expected at the moment).Note also that we will get the US jobless claims figures at the same time, which could steal the show in case we get big deviations in the data. This article was written by Giuseppe Dellamotta at investinglive.com. Source: investinglive.com (Read Full Article)
The devil will be in the details once again when it comes to the US CPI report later
Let’s start with the expected figures. As always, the core estimates are the most significant ones to pay attention to. And in the August report later, the consensus is for core CPI to come in at +0.3% m/m. That is the same as July. But if you drill down to an added decimal point, the expected is +0.32% m/m for August – which is also what we saw with the July report.Meanwhile, core CPI from an annual basis is expected to come in at +3.1% y/y. That is again the same as July once you round up but the extra decimal point makes for +3.10% y/y for the August estimate as opposed to +3.06% y/y for July. So, that is the consensus expectation going into the report release later.However, what do the other numbers say?In July, we did see an acceleration in core prices but it was mostly driven by services instead of goods. That helped to give markets some sense of relief that the tariffs passthrough is not quite yet that impactful. So, what can we expect today?For one, base effects are expected to help with a rebound in energy prices which declined by 1.1% m/m in July. MNI estimates are for a bump up by 0.8% this month. Food prices are also expected to move up on the month, so just keep that in mind.But the most important detail will be to look at core goods prices. And the expectation is for that to come up higher again, with MNI estimates at +0.30% m/m. That will be up from the +0.21% m/m reading in July, which was below consensus expectations.With markets already fully pricing in a 25 bps rate cut for next week, the question will be is there enough evidence – or should I say lack thereof – today to lean towards chasing a 50 bps rate cut? That will require the inflation numbers to fall below estimates with again another month of underwhelming core goods prices.In other words, that will translate to another month where the tariffs passthrough on prices has yet to meaningfully materialise.By year-end, traders are pricing in ~68 bps of rate cuts. And if there is a flip side where the inflation numbers run hotter than expected, we should see traders reprice this one. A move in September looks to be a given but traders are not fully convinced of a more aggressive move for next week. So, that also casts some doubt about the Fed needing to move consecutively in September, October, then December.As such, if there is reason to pull back on rate cuts pricing, expect it to show up in the pricing by year-end and not so much so for September. However, the numbers today could tee up how the Fed wants to set up their communication for next week.I’ll be back with some analyst previews in just a bit. This article was written by Justin Low at investinglive.com. Source: investinglive.com (Read Full Article)
S&P 500 Technical Analysis: The dovish bias remains a tailwind for the market
Fundamental OverviewThe soft NFP report on Friday was again faded completely by the stock market because of the focus on Fed rate cuts. In fact, the dovish bets on the Fed increased and the market is now expecting three rate cuts by year-end (68 bps). Moreover, we have also an 8% probability of a 50 bps cut in September but that will likely happen only if we get a soft CPI report today. In that case, the stock market might get another boost to push into new all-time highs.The bigger picture hasn’t changed much as the stock market continues to see better growth ahead despite all the doom and gloom coming from analysts and economists. The market doesn’t care about what has happened in the past quarters but how things are likely to evolve in the next quarters. And those positive expectations are supported by the upcoming rate cuts and the fact that things are not as bad as people think. We just have a frozen labour market most likely due to the uncertainty created by Trump’s policies in the first half of the year. That is now behind us, and the rate cuts could spur growth and improve economic activity, which is a good thing for the stock market.S&P 500 Technical Analysis – Daily TimeframeOn the daily chart, we can see that the S&P 500 is trading inside what looks like a rising wedge. If we move into the top trendline, we can expect the sellers to step in with a defined risk above the trendline to position for a drop into the bottom trendline targeting a breakout. The buyers, on the other hand, will want to see the price breaking higher to increase the bullish bets into new all-time highs, but will also continue to lean on the bottom trendline to keep pushing into the upside.S&P 500 Technical Analysis – 4 hour TimeframeOn the 4 hour chart, we can see that we have a minor upward trendline defining the bullish momentum. The buyers will likely continue to lean on the trendline with a defined risk below it to keep pushing into new highs, while the sellers will look for a break lower to target a pullback into the bottom trendline of the wedge.S&P 500 Technical Analysis – 1 hour TimeframeOn the 1 hour chart, there’s not much we can add here other than highlighting the support zone around the trendline and the 6,520 level. In case the price moves into that zone, we can expect the buyers to step in to position for a rally into new highs, while the sellers will target a breakout to the downside to extend the drop into the 6,420 level next. The red lines define the average daily range for today.Upcoming CatalystsToday we get the US CPI report and the latest US Jobless Claims figures. Tomorrow, we conclude the week with the University of Michigan Consumer Sentiment report. This article was written by Giuseppe Dellamotta at investinglive.com. Source: investinglive.com (Read Full Article)

 Bitcoin
  Ethereum
  Tether
  XRP
XRP  Wrapped SOL
  USDC
USDC  Lido Staked Ether
  TRON
TRON  Dogecoin


